

Momentum trader. Looking for bases that break and volume that shakes. If I'm short your dogsh*t stock it's not personal. NOT financial advice!
Terminal City
Joined September 2012
- Tweets14.2K
- Following511
- Followers1.5K
- Likes5.5K
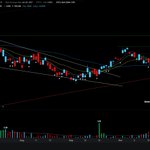



$TXN Buying strength paid handsomely here. The 315 pivot is within sight. Equity curve for Oct has been flat all month, until the last couple of days.
This is important feedback. There is definitely a character change out there, lets see if it can be sustained.


Hmm, buying strength has not worked for some time, but I took the opening range breakout just now on $TXN and it's working. Character change? Here's the pretty pic. This is all in the context of a much larger bullish pattern as per the posts below.

$DFTX close up, 65-min. As per the setup below here is a closer look at the interaction with the large wedge, the HVC from 6/22 and the bottom of the monthly value area. Still of course below the 50d MA.

$DFTX Super interesting chart. Wedged into the big gap, recovered it, held it, breaking up from the wedge and trying to recapture the HVC from 6/22. Trying a spec long here. Not quite ripe but worth a shot.

$DFTX Super interesting chart. Wedged into the big gap, recovered it, held it, breaking up from the wedge and trying to recapture the HVC from 6/22. Trying a spec long here. Not quite ripe but worth a shot.
So we have neoclouds down 30-70% (without a bounce mind you!) and Musk comes out yesterday and talks them down? FYI, they closed up today. Don't know if this would be a @Crowded_Mkt_Rpt news failure or if Musk is a contrarian signal. Perhaps a little column A, a little column B.
Hmm, buying strength has not worked for some time, but I took the opening range breakout just now on $TXN and it's working. Character change? Here's the pretty pic. This is all in the context of a much larger bullish pattern as per the posts below.
$TXN update. A month later and the RS phase remains in place. Earnings did not derail the setup either. I think entry was today. Only semi I would touch outside $QCOM (setup I just posted)

$TXN update, 2 days later, daily and weekly. Another higher high as the bullish wedge break is looking more real to me. Recovered all the key MAs, now entering a relative strength phase. The wedge base is the first one after the big break of the larger base on the weekly.


$QCOM 195-min. Find it interesting that while semis were tanking the last 2 weeks this one just went sideways and compressed. Breaking up out of the compression today. Beachball underwater?

$DDOG 5 months of sideways above the last pivot trying to break up on the weekly. The daily shows the recent backtest of the monthly value area, the 50d MA, and the recovery of the 21d EMA.


$LNG Weekly and daily. Very very pretty, all taking place at ATHs. Would keep an eye out for some consolidation at this pivot. Don't think energy is over, not by a long shot, but a little rest seems likely, and buyable.


Thoughts on the Hellebuyck trade for the @NJDevils
1) Were already sneaky good with a rebuilt top 9, a veteran D corps, and no key injuries
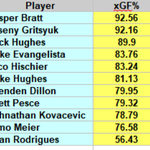
2) 5v5 xGF% 64%, tops in the league, meets the eye test, only issue was in net. Legit contenders.
3) No cap space for Quinn Hughes now.
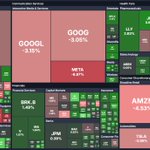
This is a wild heat map! A map like this will crush the weighted indexes, which really masked the rotation. Courtesy of @Deepvue.


Interestingly, as good as $BTC looks as per the post below, I find $ETH looks kind of precarious here. I don't think this chart can take another test of that 2355 level, and it gets pretty thin under that. Line in the sand for sure. Daily and 2hr chart,


$CRCL post-mortem. Will carry the $CRCA position forward. If one believes that the action over the last 6 weeks is corrective (as I do), and we are getting a brother wave to the initial one, the measured move is to 135 or so, also the area of the spring high.


$BTC Bitcoin looking good, I think last week's low is the new line in the sand for bully.

