

Invest Smarter with Signal Sigma: Professional-grade strategies, automated insights, and risk tools. Try free at https://xitter.cf/t.co/Ng2smTsc6F No card required.
Bucharest, Romania
Joined January 2013
- Tweets3.5K
- Following273
- Followers6.2K
- Likes30.1K




Pinned Tweet
Agent Sigma is online!
Merging the power of AI with our expansive datasets and tools, this new functionality will supercharge your workflow!
Agent Sigma can do everything you can do in the app:
Set up a Stock Screener or Market Study ☑️
Launch a Backtest ☑️
Create a Ranking Model ☑️
Add Tickers to a Watchlist and configure it ☑️
Group Assets in a Portfolio ☑️
...or really just about anything you can think of!
The use cases are so broad that we really need your help to improve here -- just give us a thumbs up or thumbs down after an answer and let us know if the Agent is doing a good job for you! Enjoy!
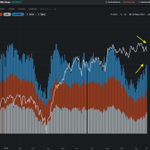
Can't say I've seen Market Breadth move in the opposite direction to the headline index, but there's a first time for everything.
Rotation, not liquidation.

The Options Structure Dataset, previously only available via API, is now live as part of the asset details interface.
Besides visualization of the 90 + new metrics, you can compare the change across contracts and use Agent Sigma to identify unusual flows.
Give it a go!

This is why semiconductor $SMH hedging is highest in March 2027, the quarter after Q4 results are announced and we get more clarity into both planned and realized CAPEX spend from hyperscalers.


$META's CAPEX spending plans are relevant for the whole AI infrastructure sector.
There is a very large residual spend that should occur in Q4'26 to the tune of 56B. I have my doubts this is physically feasible, but it's what company guidance dictates.
CAPEX plans for 2027 has not been formally announced last night, but the street consensus doesn't reach very far above what's expected in Q4 on a quarterly basis ($200B - $250B).
This is how it would pan out on a chart (if spend were equally distributed).

JUST IN : META IS PLANNING TO ISSUE NEW SHARES TO FUND AI INVESTMENTS
IT CAN BE ANNOUNCED AS SOON AS TODAY
$META
Andrei Sota retweeted

Ultimately, it goes to show 1) how powerful simple but time-tested rules and strategies are, 2) the best way to test LLM supported portfolios may basically be live, and 3) maybe there is still hope for us all 😉
8/8
No valid BUY signal (short term) was recorded after yesterday's bounce.
The signal is primed, waiting for the right catalyst (shaded gray area). Maybe $META's earnings will do it.
live.signal-sigma.com/invita…

NEW - Technical Analysis Module is LIVE!
Clicking on a Ticker name anywhere inside the app will now take you to the brand new asset details page, where you can drill down into specifics.
More tabs to come in this section, expect to find all of the essentials + the options metrics dataset, all in Signal Sigma style!

The correlation between oil and bonds has always reverted from similar low levels.
Translation: from here on out, the market is telling us higher oil prices are going to cause a slowdown in the economy.
On chart: low correlation = higher oil translates to higher yields.
High correlation: higher oil leads to lower yields as growth is snuffed out.

Related: $RSP's weekly gain of +2.6% versus $SPY has turned the relative ratio of equal-weight versus cap-weight sharply higher.
So far, the move fits historical patterns, but is not yet at an extreme. As such, the rotation still has room to run and growth may experience more weakness versus value and the rest of the market.

Market Breadth argues for a rotation and not an outright liquidation in the market.
The number of stocks trading above key averages has not collapsed in line with the index, as the capital flight from growth $IVW to value $IVE proves resilience.
A broadening at this stage would be a saving grace for the bulls, but watch out below if this metric also gives way.
After the close update: total GEX in semiconductors $SMH now equal to July 29'th, the day before we found out Situational Awareness blew up.
Institutional accumulation is showing the same level of interest at around the same price for the sector.
We should at least see GEX normalize before the next leg higher or lower from here.
Full study here: live.signal-sigma.com/invita…

Semiconductors under pressure again, but institutions have been loading up on the dip, despite ultra negative GEX.
Last time we've seen this type of contrarian positioning was when $SMH was trading at a similar price and before it would find a temporary bottom in the next 3-4 days.
Study link: live.signal-sigma.com/invita…

Andrei Sota retweeted

Sun Oct 18
Does the tail wag the dog?
Hat-tip to @Signal_Sigma.
I looked at Andrei’s intriguing finding (his tweet below) ... but confined my analysis to QQQ. I wanted to see if I could I duplicate Andrei's finding, could quantify its frequency, and then wanted to look at Friday's potential signal.
Indeed, when GEX reaches extremely negative values and big buyers simultaneously step in through dark pools, QQQ has bounced.
See attached table. (Worth your time.)
Since 2022, only two cases (2024, 2025) when that confluence of indicators occurred. For each of those, an upside move in the Nasdaq followed ... greater than 5%, both at 10- and 20-days.
Friday (Oct 16) was the third such confluence.👇
Does the tail wag the dog?
Can heavy institutional buying and market maker positioning actually drive the market’s next move?

Semiconductors under pressure again, but institutions have been loading up on the dip, despite ultra negative GEX.
Last time we've seen this type of contrarian positioning was when $SMH was trading at a similar price and before it would find a temporary bottom in the next 3-4 days.
Study link: live.signal-sigma.com/invita…
Andrei Sota retweeted
Sun Oct 18
Semi-Major Announcement
For the past year I’ve been preoccupied with long-flat strategies for the equity indices. The idea is simple: stay long when a confluence of key data points line up, and step aside into cash ... or alternatives ...when it doesn’t.
Part I of a Two-part Tweet:
Why I’m moving from an S&P 500-centric workflow ... to a Nasdaq 100-centric one.
1/ Follow the force. The dominant driver of earnings growth and market leadership, now and for the foreseeable future, is technology, and AI above all. The Nasdaq 100 is that driver, nearly undiluted.
2/ The S&P 500 is a bag of a lot of stuff: utilities, staples, REITs, legacy industrials. Much of it isn’t likely to be going anywhere. Owning the whole bag means owning the drag along with the engine.
3/ The S&P’s leadership is already the same handful of tech names. So the question is simple: why hold the driver diluted when you can hold it directly?
4/ Cleaner signals. When one force moves the index, the flows that matter (options positioning, market maker hedging, dark-pool buying) read more clearly on QQQ than on a 500-stock blend.
5/ Less noise, less work. Fewer moving parts means less data to chase and more attention on what matters most.
This year the Nasdaq 100 tactical strategy (image excerpt below) is up about 34% vs QQQ’s +16%, with a max drawdown of −6.2% vs −11.7%.
Same engine (QQQ), less injury (DD stress).
The portfolio imaged below has been live, locally, since Feb. In simplest terms, the signaling methodology looks at volatility based upon the NYU Vol Lab's APMEM volatility forecast research + @Signal_Sigma 's Pro Options and Dark Pools data selects.
Of special note ... the sell QQQ signal (derived from the aforementioned) appeared on October 6. [For what might come next ... see xitter.cf/TailThatWagsDog/status…]
Right ... soooo....
Long-flat strategies immediately raise the question: when the long QQQ model steps aside, how might that cash be safely employed?
The answer to that question relies heavily on macroeconomics ... and that’s forthcoming in Part II.


Sun Oct 18
Does the tail wag the dog?
Hat-tip to @Signal_Sigma.
I looked at Andrei’s intriguing finding (his tweet below) ... but confined my analysis to QQQ. I wanted to see if I could I duplicate Andrei's finding, could quantify its frequency, and then wanted to look at Friday's potential signal.
Indeed, when GEX reaches extremely negative values and big buyers simultaneously step in through dark pools, QQQ has bounced.
See attached table. (Worth your time.)
Since 2022, only two cases (2024, 2025) when that confluence of indicators occurred. For each of those, an upside move in the Nasdaq followed ... greater than 5%, both at 10- and 20-days.
Friday (Oct 16) was the third such confluence.👇
Does the tail wag the dog?
Can heavy institutional buying and market maker positioning actually drive the market’s next move?
Andrei Sota retweeted
Fri Oct 16
You know; the AI complex is in broad retreat: fourteen of fifteen paths are falling, with the selling heaviest among the companies supplying the build-out and lightest among the hyperscalers paying for it.
ServiceNow is the only name rising on all three measures.
Netlify Link (full report): radiant-melomakarona-167603.…
Currently working on a target zero-correlation thematic basket to diversify AI risk. I think this will probably make a nice strategy (perhaps portfolio) addition to @Signal_Sigma ... and become one to follow. We'll see.

Our data confirms this, but it's a bit like looking in the rear-view mirror.
Accumulation trends (obvious in the price action as well) favor the value / mid-cap factors for now.


Institutional investors are doubling down on tech stocks:
37% of global fund managers are now overweight technology stocks, up from 30% in September, and the highest reading since August 2020, according to a BofA survey of 161 participants overseeing $453 billion in assets.
Technology also has the largest overweight positioning of all sectors.
Pharmaceuticals and Industrials follow, with 23% and 22% overweight, respectively.
On the other hand, 34% of institutional investors are underweight Consumer Discretionary, the sector's most bearish positioning since the 2008 Financial Crisis.
Consumer Staples has the 2nd-most bearish positioning, with 32% of managers underweight.
Institutional investors are doubling down on tech and turning against consumer stocks.


Semiconductors under pressure again, but institutions have been loading up on the dip, despite ultra negative GEX.
Last time we've seen this type of contrarian positioning was when $SMH was trading at a similar price and before it would find a temporary bottom in the next 3-4 days.
Study link: live.signal-sigma.com/invita…
Institutional Dark Pool flows favor stocks and commodities versus gold and treasuries -- basically confirming the allocation in the Enterprise model.
Note the high daily index in $SPY recorded yesterday, on what was otherwise a low-ish volume day.


Couple of notes on yesterday's tech meltdown:
- lowest dollar volume for advancing issues in the past 2 years;
- the total dollar volume was mediocre, yet declining volume was near previous highs;
- institutions were buyers throughout the last period in all market cap segments;
See for yourself: live.signal-sigma.com/invita…

After reaching a record high this summer, the stocks-bonds correlation is starting to turn.
A declining correlation indicates the market is transitioning from an "inflation-dominated" regime back toward a "fundamentals-dominated" regime. Aka "Normal".
As rate volatility stabilizes (MOVE < 100), equities are becoming less sensitive to pure yield swings and more sensitive to their own earnings/growth fundamentals.
This is to say that lower yields won't automatically translate into stocks ripping higher. But bonds will start working as a hedge again.
On another note, heavy bullish options positioning (89.5% medium-term) and normalizing correlations point to a mean-reversion test toward $TLT's immediate resistance at $80. Institutions may have been early to dump here.
