

Alpha & OG hunter .Influncer, Ambassador & Web3 KOL. | AMB @SkipShiftDefi | KOL of @SuperExet @Fore_Gate | DM TG: https://teapawt.net/t.co/BeBlGwkTAV
Joined December 2022
- Tweets14.3K
- Following1.6K
- Followers5.8K
- Likes44.1K







Pinned Tweet
Hey $PAWS onchain claimer let's play some $SOL giveaway to who don't have $SOL gas fees.
✅ Follow @SmCrypto_bro
✅ Like + RT
✅ Comment your SOL address
🧭End Before 2h of onchain claim


💰 Earn More with SuperEx Multi-Crypto Earn! Share 12,000 USDT in Rewards! 🚀
Want to earn extra USDT while subscribing to Earn products? Here's your opportunity! 🔥
Simply subscribe to any eligible SuperEx Earn product and unlock bonus rewards based on your subscription amount!
🎁 Bonus Reward Tiers:
💵 Subscribe ≥ 500 USDT → Get 5 USDT
💵 Subscribe ≥ 1,000 USDT → Get 10 USDT
💵 Subscribe ≥ 5,000 USDT → Get 30 USDT
💵 Subscribe ≥ 10,000 USDT → Get 50 USDT
💵 Subscribe ≥ 30,000 USDT → Get 100 USDT
📅 Campaign Period: November 17–27, 2026 (UTC)
🔥 The more you subscribe, the bigger your bonus!
👉 Join the Campaign:
app.superex.live/contractCom…
🎯 Register on SuperEx:
app.superex.live/register?in…
Don't miss your chance to grab extra USDT rewards! 🚀
#SuperEx #CryptoEarn #USDT #CryptoRewards #Crypto

1
1
44
🎁 Trade Spot, Complete Challenges & Share 30,000 USDT on SuperEx!
SuperEx is bringing you an exciting Spot Trading Campaign with 30,000 USDT in total rewards! 🚀
There are 3 ways to participate and earn rewards:
🔥 1. New User Bonus – Get 10 USDT
Complete your first Spot Trade of at least 50 USDT and receive a 10 USDT Futures Trial Fund!
📅 2. Daily Trading Check-In – Share 10,000 USDT
Stay active and trade for 3, 6, or 10 consecutive days to qualify for a share of the 10,000 USDT reward pool!
🏆 3. Spot Trading Challenge – Share 10,000 USDT
Reach a cumulative Spot Trading Volume of at least 5,000 USDT and qualify to share another 10,000 USDT!
⏰ Campaign Period: November 13–23, 2026 (UTC)
🔗 Join the Campaign:
📱 APP: app.superex.live/contractCom…
💻 WEB: app.superex.live/contractCom…
🚀 Register on SuperEx:
app.superex.live/register?in…
Don't miss your chance to trade, complete challenges, and grab your share of 30,000 USDT!
#SuperEx #CryptoTrading #SpotTrading #USDT #CryptoRewards

1
61
🚨 $NVDA DOWN ANOTHER 4% — NVIDIA'S LEADERSHIP CRISIS DEEPENS.
Nvidia shares are facing renewed selling pressure after reports that the board is NOT considering reinstating Jensen Huang as CEO.
This could become a much bigger issue than a temporary stock correction.
Here's why:
1️⃣ Leadership Uncertainty
Jensen Huang spent 33 years leading Nvidia and became one of the most influential figures in the AI industry.
His departure creates uncertainty around:
- Long-term corporate strategy
- Investor confidence
- Relationships with major AI customers
- Future execution and leadership direction
Colette Kress, previously Nvidia's CFO, is currently serving as interim CEO.
2️⃣ The Comeback Narrative Is Losing Strength
There was growing pressure from prominent technology figures, including Elon Musk, to bring Jensen back.
However, reports indicate that Nvidia's board is focused on its ongoing investigation rather than discussing his reinstatement.
That removes an important potential catalyst for a quick recovery in investor sentiment.
3️⃣ The AI Trade Is Already Under Pressure
Nvidia isn't falling in isolation.
Other semiconductor and AI-related stocks are also experiencing selling pressure.
Investors are becoming more sensitive to:
- Expensive AI valuations
- Massive AI infrastructure spending
- Future data-center demand
- Whether AI revenue can justify current valuations
4️⃣ Earnings Could Be the Next Major Catalyst
Nvidia's upcoming earnings report and management outlook will be extremely important.
Investors will be watching:
- Data-center revenue growth
- Blackwell GPU demand
- Gross margins
- Future revenue guidance
- Management's ability to maintain confidence
My Take:
Nvidia remains one of the most important companies in the AI industry, but even a dominant business isn't immune to leadership uncertainty.
The bigger concern isn't simply Jensen leaving.
It's whether Nvidia can maintain investor confidence and execute its AI growth strategy without its long-time founder.
I wouldn't blindly buy this dip.
Watch the earnings reaction, volume and key support levels before taking a position.
The real question: Can $NVDA recover from its leadership crisis, or is this the beginning of a deeper correction?
What's your move?
BUY THE DIP or WAIT FOR LOWER PRICES? 👇

1
1
66
Is $EVAA preparing for another massive rally? Could it eventually reclaim its previous ATH of $13.60?
I looked into its tokenomics, market valuation, DeFi fundamentals, trading activity and technical structure. There are some interesting bullish signals, but also risks worth watching.
1/ Price action: Momentum is back
$EVAA is trading around $3.20–$3.30 in the latest November 16–17 market data.
• 24H gain: roughly 20–35% (varies by snapshot)
• 7D performance: approximately +150% to +190% on recent trackers.
• Previous ATH: $13.61 (October 27, 2025).
• Still approximately 76% below ATH.
This is a significant recovery, but the question is whether buyers can sustain it.
2/ Market cap & token supply
• Maximum supply: 50M EVAA
• Circulating supply: Data providers disagree.
• CoinGecko reports approximately 6.62M.
• CoinMarketCap and CoinGlass report approximately 17.85M.
• Reported market cap: roughly $21M–$57M.
• FDV: approximately $158M–$169M.
This supply discrepancy is important. Investors should verify the actual circulating supply before making valuation assumptions.
3/ Fundamental strength
EVAA is a decentralized lending and borrowing protocol built on TON, integrated into Telegram.
Its ecosystem offers:
• Crypto lending and borrowing.
• Collateralized loans.
• Telegram Mini App access.
• TON ecosystem integrations.
• Governance participation through the EVAA token.
The project has disclosed more than $2.5M in funding, with investors including Animoca Brands, TON Ventures, WAGMI Ventures and Polymorphic Capital.
Its official token materials also describe potential DAO-funded buybacks and burns using protocol revenue.
4/ The TVL problem
According to DefiLlama:
• Current TVL: approximately $6.76M.
• Active loans: approximately $3.49M.
• TVL was $84.3M at its January 2025 peak.
This is something bulls cannot ignore.
The token's price recovery needs to be supported by renewed protocol adoption, liquidity and actual revenue growth.
5/ Technical analysis: Important levels
Based on recent price action and Fibonacci levels:
🟢 Support:
• $2.40–$2.50
• $2.00
• $1.70
🔴 Resistance:
• $3.80 — immediate breakout zone.
• $4.00 — psychological resistance.
• $5.00 — next major upside area.
• $6.00–$8.00 — potential expansion zone.
A strong daily close above $3.80, supported by spot buying volume, could open the door toward $4–$5.
A rejection could send EVAA back toward $2.40 or even $2.00.
6/ Derivatives: Opportunity or danger?
Recent CoinGlass data shows substantial futures activity and open interest.
That can amplify upward momentum, but it also increases liquidation risk.
I want to see spot buying confirm the rally instead of relying entirely on leveraged positions.
7/ Can $EVAA reach a NEW ATH?
My bullish scenario:
$3.80 breakout → $4–$5 → $6–$8 → $10–$13.60.
From around $3.20, reclaiming $13.60 would require approximately a 4.25x increase.
It is possible in a strong market, but it is NOT a guaranteed target.
My verdict: Cautiously bullish, but confirmation is needed.
Watch TVL growth, spot inflows, token unlocks and the $3.80 breakout.
Would you hold $EVAA for a potential new ATH, or take profits into this rally?
#EVAA #TON #DeFi

1
1
64
🚀 BINANCE ALTCOIN GAINERS: What's Behind Today's Massive Pumps?
The Binance futures market is seeing some serious momentum today, with several altcoins posting double-digit gains.
Here are the standout performers:
- $BLESS: +116.29%
- $RARE: +71.78%
- $HUMA: +31.60%
- $SPACE: +28.65%
- $CROSS: +25.15%
- $PIEVERSE: +19.38%
- $PLAY: +17.55%
- $ON: +16.20%
- $SKR: +16.10%
- $ICP: +15.07%
- $EVAA: +12.49%
What could be driving this move?
This kind of broad-based rally often comes from a combination of speculative capital rotation, short liquidations, futures positioning and renewed interest in smaller-cap altcoins.
But the interesting part is how aggressively some of these tokens are moving compared with the broader market.
A few things stand out from the data:
1️⃣ $BLESS: Open interest reportedly expanded by roughly 176–179%, alongside a massive price increase. This suggests a significant influx of leveraged positioning, not just ordinary buying.
2️⃣ $RARE: One of the strongest movers, with approximately $240M+ in futures volume. Its spot-market rally also suggests genuine buying interest beyond perpetual futures speculation.
3️⃣ $SPACE: Open interest increased around 135%, pointing to aggressive new positioning.
4️⃣ $HUMA & $CROSS: Both are attracting momentum traders as capital rotates into smaller-cap assets.
5️⃣ $ICP & $PIEVERSE: These are also benefiting from the broader interest in selected altcoin trades.
My take:
I wouldn't automatically call this the beginning of an altseason.
When tokens move 50–100% in a short period, traders need to look beyond price:
- Is spot volume confirming the move?
- Is open interest rising faster than price?
- Are short liquidations accelerating?
- Is funding becoming excessively positive?
- Are early buyers taking profits?
The biggest opportunity is often identifying a move before it becomes overcrowded.
But remember: a 100% pump can also turn into a brutal 30–40% correction.
Watch the volume, positioning and liquidity. Don't chase green candles blindly.
What's your pick from today's Binance gainers? 👀
#Binance #Altcoins #CryptoMarket #BLESS #RARE

2
5
178
🚨 WHY $BTC COULD BREAK $60,000 AND $ETH COULD TEST $1,550 NEXT WEEK.
The crypto market is showing several warning signals, and I believe another major downside move cannot be ruled out.
This isn't just about bearish sentiment. Look at the derivatives market, liquidation data, exchange flows and current market positioning.
1️⃣ BTC: The $60K level is becoming a realistic downside target.
Bitcoin is trading around $64K–$65K, but the derivatives market is showing significant stress.
• 24H BTC liquidations have approached $760M.
• Approximately 86% of those liquidations were LONG positions.
• Futures open interest remains around $44B.
• Futures volume is more than 11x spot volume.
This is important.
The market is still heavily influenced by leveraged derivatives rather than genuine spot demand. If BTC loses the $62K–$61K support zone, another wave of forced liquidations could accelerate the decline toward $60K.
2️⃣ Exchange flows: A warning, not a confirmation.
Bitcoin exchange netflow recorded approximately 6,180 BTC in net outflows on November 13, according to CoinGlass.
However, total exchange deposits were still around 31,229 BTC, up 8.87% over seven days.
This suggests that although accumulation-related withdrawals exist, substantial BTC is still moving onto exchanges.
If selling pressure increases while liquidity remains weak, the market could struggle to recover.
3️⃣ ETH: Why $1,550 is possible.
Ethereum looks particularly vulnerable.
• ETH is trading around $1,725.
• 24H liquidations reached approximately $466M.
• Around 92% were LONG liquidations.
• Futures open interest remains elevated relative to spot market activity.
• Funding rates have turned negative.
ETH has already lost significant value, and a breakdown below $1,700 could expose the $1,650–$1,600 region.
If selling accelerates, $1,550 becomes a possible downside target.
4️⃣ The interesting contradiction: ETH exchange reserves.
ETH exchange balances declined by approximately:
• 18.3K ETH in 24 hours.
• 88.6K ETH in 7 days.
• 376.4K ETH in 30 days.
This normally indicates reduced immediately available exchange supply.
So why am I bearish?
Because declining exchange balances don't automatically mean prices must increase. Derivatives liquidations, declining demand and forced selling can overpower the supply-side signal in the short term.
5️⃣ My downside scenario for next week:
$BTC:
• $62K–$61K: Immediate support.
• $60K: Major psychological target.
• Below $60K: Potential acceleration if liquidations continue.
$ETH:
• $1,700: Immediate support.
• $1,650–$1,600: Next downside zone.
• $1,550: Extended bearish target.
My conclusion:
I am watching three things very closely:
1. Whether BTC loses $62K.
2. Whether open interest continues declining alongside price.
3. Whether spot exchange inflows increase while buying demand weakens.
If these signals align, a liquidation-driven move toward BTC $60K and ETH $1,550 next week becomes a serious possibility.
But remember: exchange outflows and negative funding are also potential reversal signals. These are bearish scenarios, NOT guaranteed targets.
Don't blindly short. Watch the confirmation.
What's your prediction?
$BTC $ETH #Bitcoin #Ethereum #CryptoCrash


1
233
My previous $BTC analysis has been corrected, and the market is moving in line with the bearish scenario I discussed.
I highlighted the possibility of Bitcoin dropping toward $65K within 24 hours, and the downside pressure has reinforced that view.
The key lesson here is simple: don't ignore market structure, liquidity and momentum.
I'm still watching the important support and resistance levels closely. One analysis doesn't guarantee the next move, so stay disciplined and manage your risk.
The market doesn't care about our bias. Follow the price, not your emotions. 📉
#BTC #Bitcoin

🚨 BITCOIN AT RISK: WHY $BTC COULD CRASH TOWARD $65,000 WITHIN THE NEXT 24 HOURS!
Bitcoin is showing serious weakness, and I don't think the downside risk is over yet.
A move toward $65K might sound aggressive, but several factors are lining up for another potential leg down.
Here's what I'm watching 👇
1️⃣ $70K SUPPORT HAS COLLAPSED
BTC has already lost the psychological $70,000 level and traded around $68,500–$69,000.
Losing this important support could trigger another wave of panic selling, especially if buyers fail to reclaim $70K.
2️⃣ MASSIVE LONG LIQUIDATIONS
The derivatives market has taken a brutal hit.
• Around $736M in BTC liquidations over 24 hours.
• Approximately 96% came from LONG positions.
• Futures trading volume surged above $80B.
• Open interest dropped around 5%.
This tells us leveraged traders are getting wiped out.
If BTC continues falling, more forced liquidations could accelerate the decline.
3️⃣ ETF OUTFLOWS ARE A BIG WARNING
US spot Bitcoin ETFs recorded approximately $1.44B in cumulative outflows over five consecutive sessions.
Institutional demand is an important source of buying pressure. Persistent withdrawals make it harder for the market to absorb selling pressure.
4️⃣ EXTREME FEAR IS BACK
Market sentiment has moved into extreme fear territory.
When investors become defensive, capital tends to leave risky assets. If traditional markets and technology stocks remain under pressure, crypto could face additional selling.
5️⃣ IMPORTANT PRICE LEVELS
Here are the levels I'm watching:
• $70,000–$71,000: Resistance zone
• $68,500: Immediate downside trigger
• $67,000: Next important support area
• $66,000: Potential intermediate target
• $65,000: Major downside target
If BTC loses $68,500 decisively, followed by weak recovery attempts, a fast move toward $65K becomes increasingly possible.
🎯 MY 24-HOUR BTC OUTLOOK
My bearish scenario:
$69K → $67K → $66K → $65K.
However, this isn't guaranteed.
If Bitcoin quickly reclaims $70K–$71K and holds above it, the bearish scenario could weaken significantly.
My personal view: I'm not comfortable calling a bottom while selling pressure remains this aggressive. Another 5% downside from current levels is absolutely possible.
Watch the $68.5K level closely. The next 24 hours could be extremely volatile.
Are we going to see BTC at $65K before a meaningful recovery?
#Bitcoin #BTC #Crypto

1
253
Don't forget check our previous analysis on $AKE .

🚨 $AKE: ANOTHER MASSIVE PUMP COMING, OR IS THIS JUST A BULL TRAP?
$AKE (AKEDO) is showing some serious volatility, and I think this chart deserves attention.
Let's look beyond the green candles.
AKE previously rallied to approximately $0.16, reaching an ATH around $0.1426 in September 2026. But what followed was brutal.
The token suffered a massive correction, eventually trading around the $0.0018–$0.002 region.
Now it's attempting a significant recovery.
But is this the beginning of another rally or just an opportunity for early holders to exit?
Here's what the data tells us:
📊 1. The price recovery
AKE recently bounced from approximately $0.0018–$0.00195 toward $0.005.
That's a substantial recovery, but the token is still roughly 96% below its previous ATH.
A bounce from the bottom doesn't automatically mean the bigger downtrend has ended.
📊 2. Volume is getting interesting
Recent CoinGlass data showed:
• Spot volume: approximately $29.7M
• Futures volume: approximately $759.8M
• Open interest: approximately $85M
• Spot net inflow: approximately $1.4M
The biggest concern? Futures volume is over 25 times spot volume.
This suggests significant speculative activity. It can fuel another rally, but excessive leverage can also make a reversal extremely violent.
📊 3. Supply is another major concern
• Maximum supply: 100 BILLION AKE
• Circulating supply: approximately 22.8 BILLION
• Upcoming unlock: approximately 2.1 BILLION AKE on November 21.
That's around 2.1% of the total supply entering the unlock schedule.
Future supply expansion is something investors shouldn't ignore.
📊 4. What levels matter now?
My levels to watch:
• $0.0020–$0.0025: Important recovery support zone.
• $0.005–$0.006: Immediate resistance area.
• $0.008–$0.010: Potential next upside zone if momentum continues.
• $0.0018: A critical level to watch if the recovery fails.
My personal take:
I'm not ready to call this a confirmed bull reversal.
For a healthier recovery, I want to see:
1. Sustained spot buying rather than futures-driven speculation.
2. Higher lows on the daily timeframe.
3. A convincing breakout above resistance.
4. Open interest growing without excessive funding rates.
5. Price holding its breakout during a retest.
If these conditions develop, another significant rally becomes a scenario worth watching.
But if price pumps while leverage keeps increasing and spot demand disappears, this could easily become another bull trap.
The real question: Can $AKE rebuild its market structure after that massive collapse, or are we witnessing just another temporary bounce?
I'm watching the volume, open interest and supply situation very closely.
What's your view? Another $AKE rally or another trap? 👀
#AKE #AKEDO #Crypto #Altcoins

1
416
🚨 CRYPTO MARKET IS CRASHING — $330M+ LIQUIDATED IN JUST 2 HOURS!
The selling pressure across the crypto market is getting intense, and major cryptocurrencies are losing critical psychological levels.
Here's what we're seeing:
🔴 $BTC drops below $67,000
🔴 $ETH falls below $1,900
🔴 $XRP loses the $1.00 level
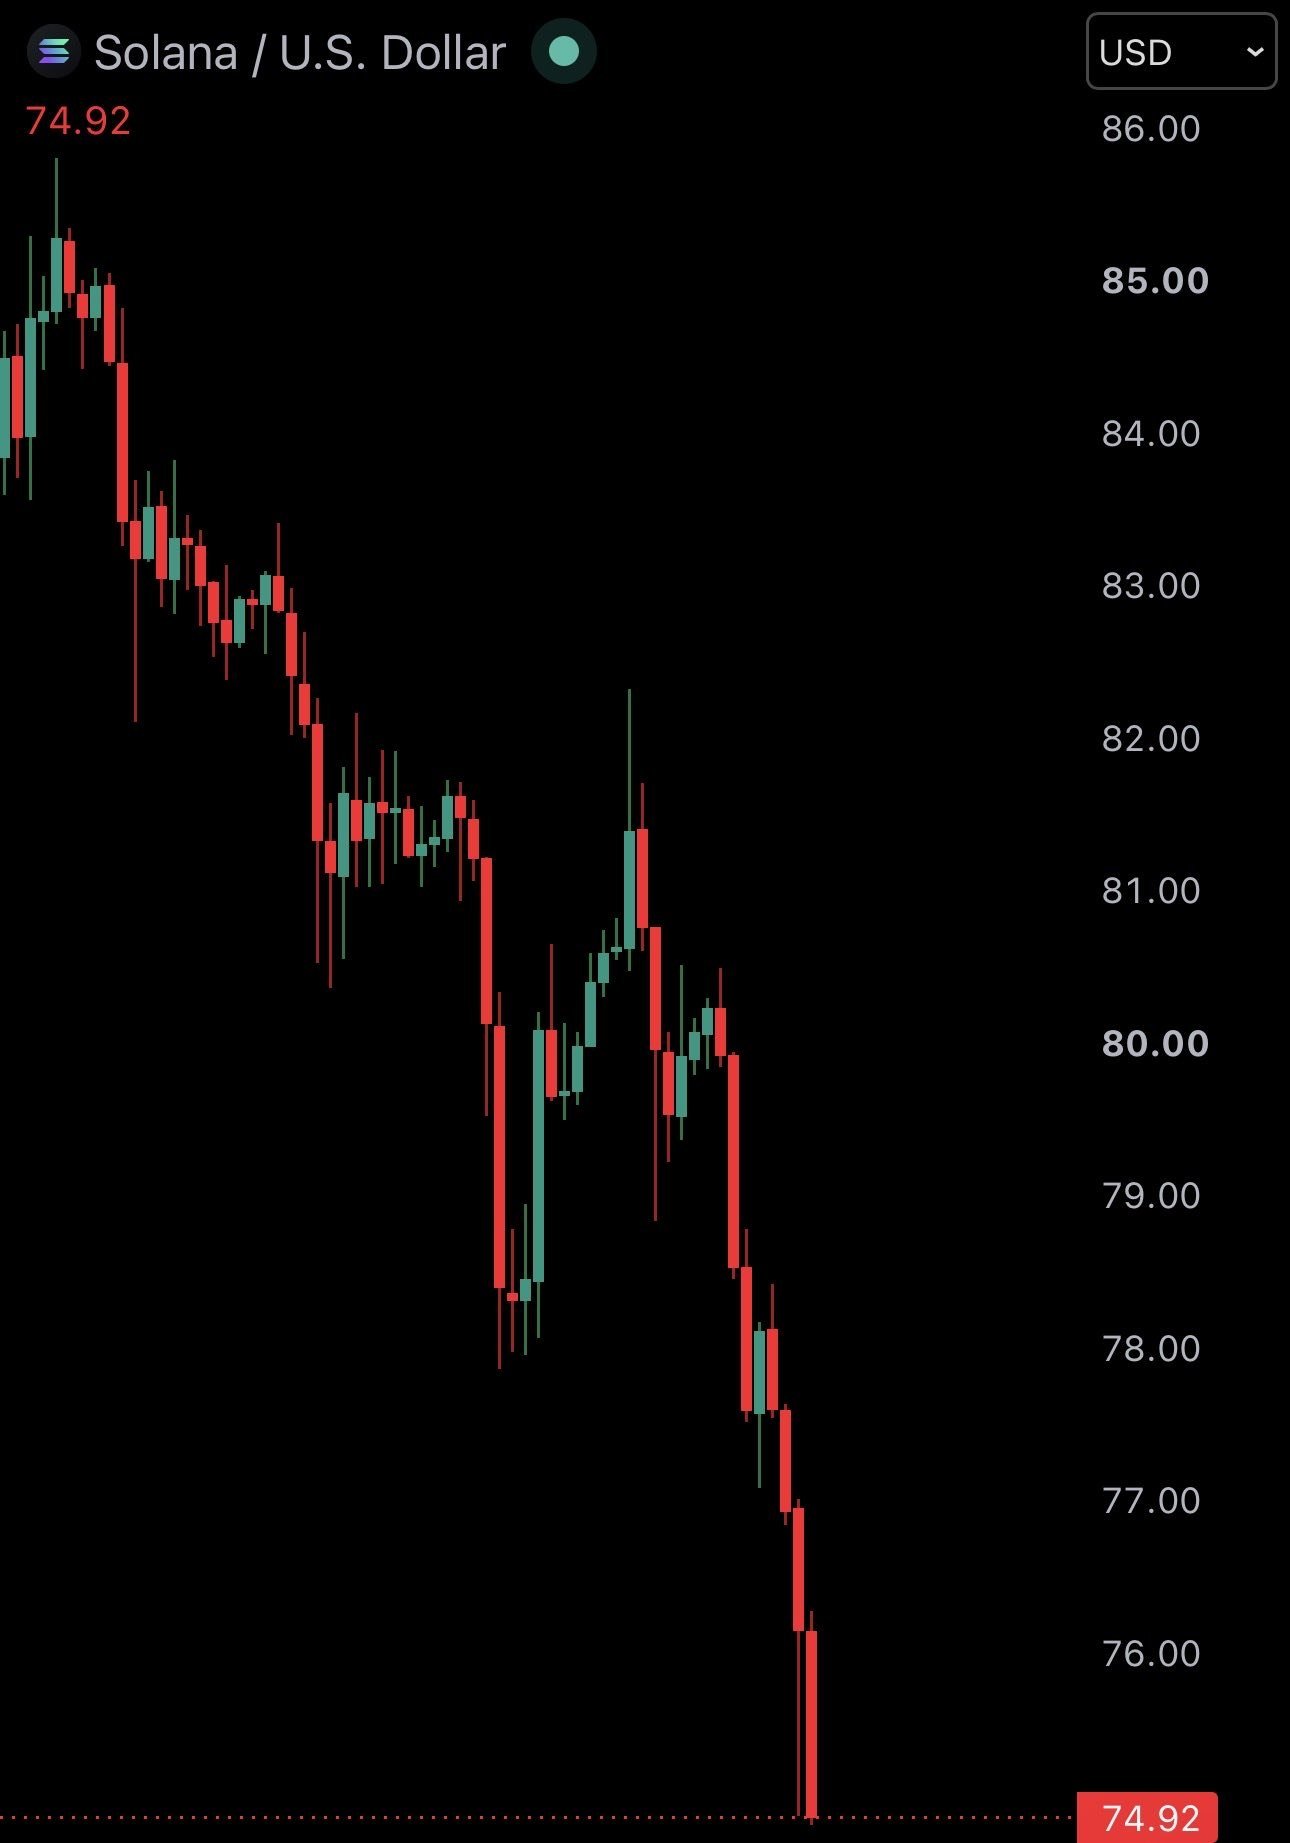
🔴 $SOL crashes below $75
More than $330 million in crypto positions have been liquidated within just 2 hours.
But what does this actually mean?
This isn't just ordinary selling. When the market starts breaking important support levels, leveraged traders get forced out of their positions.
Long liquidations create additional selling pressure, which can trigger another wave of liquidations. That's how a normal correction can turn into a sharp market-wide flush.
What's worrying right now?
1️⃣ BTC losing $67K could increase bearish sentiment across the market.
2️⃣ ETH below $1,900 shows that weakness isn't limited to Bitcoin.
3️⃣ XRP below $1 and SOL below $75 put additional pressure on altcoin sentiment.
4️⃣ If selling volume continues increasing, we could see another wave of forced liquidations.
Is this the beginning of a deeper crash or a potential liquidation-driven bottom?
That's the big question.
I wouldn't rush to buy every dip right now. The market needs to show signs of stabilization, stronger buying volume and a recovery of important support levels.
Remember, after massive liquidations, sharp relief bounces are also possible.
Stay cautious, manage your leverage, and don't let emotions control your trades.
The next few hours could be extremely important for the entire crypto market.
What's your move: BUY THE DIP or WAIT FOR LOWER LEVELS? 👇
#Bitcoin #BTC #Ethereum #ETH #CryptoCrash #Altcoins



3
243
🚨 $BTW (Bitway): Is Another Massive Breakdown Coming?
A lot of people are looking at BTW after its massive correction, hoping for another recovery. But I'm watching a potentially much more bearish scenario.
Here's why I'm concerned.
1️⃣ The bearish flag structure
After the massive rejection from its $2.75 ATH, BTW has experienced a significant downward move.
If the recent consolidation is forming a bearish flag, this could simply be a temporary relief phase before another leg down.
A weak bounce with lower highs, declining buying pressure and a breakdown below flag support would strengthen this bearish setup.
2️⃣ Momentum is deteriorating
BTW has lost substantial value over the past few weeks.
Recent market data shows:
• Approximately 36% weekly decline.
• Nearly 19% decline in 24 hours in one market snapshot.
• Price trading around the $0.80–$0.88 area in recent snapshots.
This isn't the kind of price action I'd want to see before calling a confirmed bottom.
3️⃣ Token supply is another concern
BTW has a maximum supply of 10 billion tokens, while only a portion is circulating.
Another 101.6M BTW tokens are scheduled to unlock on December 2.
Increasing circulating supply can create additional selling pressure if demand doesn't absorb it.
4️⃣ My downside targets
If the bearish structure confirms and major supports fail, I'm watching these potential downside zones:
🎯 $0.50 – First major downside area to monitor.
🎯 $0.30 – Deeper correction scenario.
🎯 $0.08 – Extreme bearish target.
🎯 $0.05 – Potential capitulation zone.
My conclusion:
I wouldn't blindly buy every dip in BTW.
A breakdown from the bearish flag could trigger another significant correction. The $0.08–$0.05 zone is an extreme downside scenario, not my guaranteed base-case prediction.
For the bullish side to regain control, BTW needs to reclaim important resistance levels with strong spot buying volume.
What do you think?
Is BTW preparing for another recovery, or are we about to see $0.08–$0.05?
#BTW #Bitway #Crypto

1
3
668
🚨 $AKE: ANOTHER MASSIVE PUMP COMING, OR IS THIS JUST A BULL TRAP?
$AKE (AKEDO) is showing some serious volatility, and I think this chart deserves attention.
Let's look beyond the green candles.
AKE previously rallied to approximately $0.16, reaching an ATH around $0.1426 in September 2026. But what followed was brutal.
The token suffered a massive correction, eventually trading around the $0.0018–$0.002 region.
Now it's attempting a significant recovery.
But is this the beginning of another rally or just an opportunity for early holders to exit?
Here's what the data tells us:
📊 1. The price recovery
AKE recently bounced from approximately $0.0018–$0.00195 toward $0.005.
That's a substantial recovery, but the token is still roughly 96% below its previous ATH.
A bounce from the bottom doesn't automatically mean the bigger downtrend has ended.
📊 2. Volume is getting interesting
Recent CoinGlass data showed:
• Spot volume: approximately $29.7M
• Futures volume: approximately $759.8M
• Open interest: approximately $85M
• Spot net inflow: approximately $1.4M
The biggest concern? Futures volume is over 25 times spot volume.
This suggests significant speculative activity. It can fuel another rally, but excessive leverage can also make a reversal extremely violent.
📊 3. Supply is another major concern
• Maximum supply: 100 BILLION AKE
• Circulating supply: approximately 22.8 BILLION
• Upcoming unlock: approximately 2.1 BILLION AKE on November 21.
That's around 2.1% of the total supply entering the unlock schedule.
Future supply expansion is something investors shouldn't ignore.
📊 4. What levels matter now?
My levels to watch:
• $0.0020–$0.0025: Important recovery support zone.
• $0.005–$0.006: Immediate resistance area.
• $0.008–$0.010: Potential next upside zone if momentum continues.
• $0.0018: A critical level to watch if the recovery fails.
My personal take:
I'm not ready to call this a confirmed bull reversal.
For a healthier recovery, I want to see:
1. Sustained spot buying rather than futures-driven speculation.
2. Higher lows on the daily timeframe.
3. A convincing breakout above resistance.
4. Open interest growing without excessive funding rates.
5. Price holding its breakout during a retest.
If these conditions develop, another significant rally becomes a scenario worth watching.
But if price pumps while leverage keeps increasing and spot demand disappears, this could easily become another bull trap.
The real question: Can $AKE rebuild its market structure after that massive collapse, or are we witnessing just another temporary bounce?
I'm watching the volume, open interest and supply situation very closely.
What's your view? Another $AKE rally or another trap? 👀
#AKE #AKEDO #Crypto #Altcoins
🚨 BITCOIN AT RISK: WHY $BTC COULD CRASH TOWARD $65,000 WITHIN THE NEXT 24 HOURS!
Bitcoin is showing serious weakness, and I don't think the downside risk is over yet.
A move toward $65K might sound aggressive, but several factors are lining up for another potential leg down.
Here's what I'm watching 👇
1️⃣ $70K SUPPORT HAS COLLAPSED
BTC has already lost the psychological $70,000 level and traded around $68,500–$69,000.
Losing this important support could trigger another wave of panic selling, especially if buyers fail to reclaim $70K.
2️⃣ MASSIVE LONG LIQUIDATIONS
The derivatives market has taken a brutal hit.
• Around $736M in BTC liquidations over 24 hours.
• Approximately 96% came from LONG positions.
• Futures trading volume surged above $80B.
• Open interest dropped around 5%.
This tells us leveraged traders are getting wiped out.
If BTC continues falling, more forced liquidations could accelerate the decline.
3️⃣ ETF OUTFLOWS ARE A BIG WARNING
US spot Bitcoin ETFs recorded approximately $1.44B in cumulative outflows over five consecutive sessions.
Institutional demand is an important source of buying pressure. Persistent withdrawals make it harder for the market to absorb selling pressure.
4️⃣ EXTREME FEAR IS BACK
Market sentiment has moved into extreme fear territory.
When investors become defensive, capital tends to leave risky assets. If traditional markets and technology stocks remain under pressure, crypto could face additional selling.
5️⃣ IMPORTANT PRICE LEVELS
Here are the levels I'm watching:
• $70,000–$71,000: Resistance zone
• $68,500: Immediate downside trigger
• $67,000: Next important support area
• $66,000: Potential intermediate target
• $65,000: Major downside target
If BTC loses $68,500 decisively, followed by weak recovery attempts, a fast move toward $65K becomes increasingly possible.
🎯 MY 24-HOUR BTC OUTLOOK
My bearish scenario:
$69K → $67K → $66K → $65K.
However, this isn't guaranteed.
If Bitcoin quickly reclaims $70K–$71K and holds above it, the bearish scenario could weaken significantly.
My personal view: I'm not comfortable calling a bottom while selling pressure remains this aggressive. Another 5% downside from current levels is absolutely possible.
Watch the $68.5K level closely. The next 24 hours could be extremely volatile.
Are we going to see BTC at $65K before a meaningful recovery?
#Bitcoin #BTC #Crypto
🚨 CRYPTO MARKET BLOODBATH: $500 MILLION LIQUIDATED IN JUST ONE HOUR!
The crypto market is witnessing another brutal sell-off, with approximately $500 MILLION in leveraged positions wiped out within the past hour. 🔴
Major cryptocurrencies are breaking important psychological price levels, putting traders under serious pressure.
📉 MARKET DAMAGE:
🔻 $BTC: Falls below $69,000
🔻 $ETH: Falls below $1,950
🔻 $XRP: Falls below $1.01
🔻 $SOL: Falls below $80
⚠️ WHY IS THIS HAPPENING?
This type of aggressive liquidation event can create a domino effect:
1️⃣ Long Position Liquidations: Highly leveraged traders are forced out as prices break critical support levels.
2️⃣ Selling Pressure: Forced liquidations add more selling pressure, accelerating the downward move.
3️⃣ Support Breakdown: When important psychological levels fail, panic selling and stop-loss orders can trigger further downside.
4️⃣ Market Sentiment: Traders become increasingly defensive, reducing risk exposure and moving away from speculative altcoins.
🔍 WHAT SHOULD WE WATCH NEXT?
Bitcoin ($BTC): Can BTC reclaim $69K, or will this level turn into resistance? A sustained breakdown could expose lower support zones.
Ethereum ($ETH): Losing $1,950 puts ETH under pressure. Reclaiming this level will be important for a potential recovery.
XRP & SOL: Both are approaching critical psychological levels. Watch whether buyers step in or selling pressure continues.
🎯 MY TAKE:
Don't rush into buying just because the market has dumped heavily.
Liquidation cascades can create attractive buying opportunities, but they can also produce another leg down.
I'd rather wait for:
- BTC to establish a stable support.
- Liquidation pressure to cool down.
- Buyers to show genuine strength.
- A confirmed recovery rather than chasing a temporary bounce.
Remember: A market crash doesn't automatically mean the bottom is in.
The next few hours could be extremely important for the entire crypto market.
Are we witnessing a temporary liquidation cascade before a recovery, or is this the beginning of a deeper correction?
👇 What's your move: BUY THE DIP or WAIT FOR LOWER?
#Bitcoin #BTC #Ethereum #ETH #CryptoCrash #Liquidations #CryptoMarket #XRP #SOL

1
1
202
🚨 THE NEXT AI STOCK OPPORTUNITY? 6 STOCKS I'M WATCHING BEFORE THE NEXT BIG RALLY
The AI revolution is far from over. In fact, the next phase could create massive opportunities beyond NVIDIA.
Here's why I'm paying attention to these 6 stocks:
According to IDC, global AI infrastructure spending reached $121.4 BILLION in Q2 2026, up 53% YoY. IDC now projects $521 BILLION in spending for 2026.
That means the AI infrastructure race is still expanding.
🔥 MY TOP 6 AI STOCKS TO WATCH:
1. $MU – Micron Technology
• HBM memory demand is a major AI growth driver.
• AI GPUs need high-bandwidth memory.
• Potential beneficiary of continued memory supply tightness.
• My favorite AI memory-sector watchlist candidate.
2. $AVGO – Broadcom
• Custom AI accelerators and networking.
• Benefits from hyperscaler investment in custom silicon.
• Strong positioning beyond traditional GPU demand.
3. $AMD – Advanced Micro Devices
• Competing in the AI accelerator market.
• Opportunity to gain market share in AI computing.
• Worth watching for improving accelerator adoption.
4. $ANET – Arista Networks
• AI data centers require high-speed networking.
• Increasing AI workloads mean greater networking requirements.
• A potential long-term infrastructure winner.
5. $VRT – Vertiv
• AI data centers require enormous power and cooling capacity.
• Higher rack density increases infrastructure requirements.
• An interesting way to invest in AI without betting exclusively on chipmakers.
6. $PLTR – Palantir
• Enterprise AI adoption and commercial software.
• AI platforms could become increasingly important for businesses.
• Strong growth potential, but valuation remains a major consideration.
📊 WHY NOW?
The recent semiconductor sell-off has improved valuations across parts of the AI infrastructure sector.
Wells Fargo recently upgraded its outlook on US AI infrastructure stocks from negative to neutral, citing improved risk/reward after the decline.
However, slowing AI investment and rising depreciation costs remain important risks.
🎯 MY STRATEGY:
I'm not chasing green candles.
• Look for pullbacks toward major support.
• Build positions gradually rather than buying everything at once.
• Watch earnings, revenue growth and forward guidance.
• Avoid stocks trading at unreasonable valuations.
My top 3 to research first: $MU, $AVGO and $VRT.
The biggest opportunity may not be in the company building the AI model, but in the companies supplying the chips, memory, networking, electricity and cooling that make AI possible.
Which AI stock do you think has the biggest upside over the next 12–18 months?
NFA. Always DYOR. 📈

1
1
231
🚨 $AGT JUST MADE A MASSIVE MOVE IN A SINGLE CANDLE!
From $0.023155 to $0.059 — that's approximately a 155% pump in one move! 🔥
But the interesting part isn't just the pump. It's where AGT is trading now.
The token is approaching a major historical resistance zone between $0.055–$0.062. This is where things could get interesting.
📊 TECHNICAL ANALYSIS
Here are the levels I'm watching:
🔴 Major Resistance:
• $0.055–$0.062 — Previous supply zone.
• $0.065–$0.070 — Next potential resistance if buyers break above the current zone.
• $0.080–$0.090 — Higher target zone if momentum continues.
🟢 Key Support:
• $0.045–$0.048 — First potential support.
• $0.038–$0.040 — Important retracement zone.
• $0.030–$0.032 — Stronger downside support.
• $0.023–$0.025 — Previous breakout base.
These are technical zones, not guaranteed reversal points.
🧠 FUNDAMENTALS: WHAT IS $AGT?
AGT is the governance and utility token of Alaya AI, a Web3 AI data infrastructure project.
Its ecosystem focuses on:
• Decentralized AI training data.
• Community-powered data labeling.
• AI model staking.
• Data contribution incentives.
• Governance and ecosystem participation.
The AI + Blockchain narrative gives AGT an interesting fundamental angle.
💰 TOKENOMICS & MARKET CAP
• Maximum Supply: 5 Billion AGT.
• Circulating Supply: Approximately 3.26 Billion (CoinMarketCap).
• At $0.059, implied circulating market cap would be around $192M.
• Fully diluted valuation would be around $295M.
One thing to watch: supply trackers report different circulating figures, so token unlocks and actual circulating supply deserve attention.
🚀 WHAT'S NEXT?
There are two possible scenarios:
BULLISH:
If AGT breaks above $0.062 with strong volume and successfully retests it, another bullish leg toward $0.070 and potentially $0.080 could develop.
BEARISH:
If sellers defend $0.055–$0.062, a rejection could send AGT toward $0.048 or even $0.040.
My view?
A single massive candle doesn't confirm a sustainable trend reversal.
I want to see consolidation, healthy volume and a confirmed breakout above $0.062 before becoming aggressively bullish.
Also, I haven't found a verified project-specific announcement explaining this particular move. Don't confuse speculation with a confirmed catalyst.
What do you think? Can $AGT break $0.062 and start another rally, or will sellers reject it again?
Watching this one closely. 👀
#AGT #AlayaAI #Crypto #AI #Altcoins

4
4
527
🚨 CAN $INIT (INITIA) PUMP TO $0.60? A 2.4X MOVE FROM HERE?
$INIT has suddenly attracted serious market attention after its massive recovery from the $0.047 bottom. But is this the beginning of a bigger rally, or just a short-term speculative pump?
Let's break it down. 👇
📊 1. Current Market Structure
• Current price: Around $0.25
• Market Cap: ~$54M
• FDV: ~$248M
• Circulating Supply: ~219M INIT
• Max Supply: 1 Billion INIT
• 24H trading volume: $100M+
• Previous ATH: ~$1.42
The interesting part? INIT is still down more than 80% from its ATH.
📈 2. Technical Analysis: Important Levels
INIT has recovered strongly from its $0.047 bottom.
Key resistance zones:
• $0.28 – First major resistance
• $0.32 – Next breakout level
• $0.36 – Important supply zone
• $0.43 – Major resistance
• $0.58–$0.60 – Bullish target zone
Support levels to watch:
• $0.24–$0.25
• $0.21
• $0.18
A strong daily close above $0.32, followed by a successful retest, could open the door toward $0.36 and $0.43.
📌 3. Can INIT Reach $0.60?
Let's look at the numbers.
At $0.60:
• Circulating market cap: ~$131M
• Fully diluted valuation: $600M
A $131M circulating market cap isn't unrealistic for an infrastructure project if market sentiment improves and the ecosystem gains traction.
From $0.25, reaching $0.60 requires approximately 140% upside.
🔥 4. Fundamental Perspective
Initia isn't just another speculative token.
Its Interwoven Stack combines an L1 with customizable appchains supporting EVM, MoveVM and WasmVM.
The project has also attracted notable investors, including Binance Labs, Delphi Digital and Hack VC.
However, there's a serious concern right now.
🚨 SECURITY WARNING:
Initia suffered another security incident on November 10, resulting in unauthorized transfers and an emergency network halt.
Reports now indicate approximately $3.27M in cumulative assets transferred across the recent incidents.
The network's security recovery and user confidence will be crucial for its long-term performance.
⚠️ 5. Token Supply Risk
Only around 22% of the maximum supply is currently circulating.
More tokens will gradually enter circulation, creating potential selling pressure.
The next scheduled unlock is November 24, involving approximately 8.8M INIT.
🎯 My Verdict
I believe $0.60 is a possible medium-term bullish target, but it's not guaranteed.
First, INIT needs to reclaim $0.32 and $0.36 convincingly.
More importantly, the team must restore confidence after the security incidents.
If the network recovers, ecosystem activity improves, and buying volume remains strong, $0.43 and eventually $0.60 become interesting targets.
But chasing a sudden pump during a security crisis is extremely risky.
QUESTION: Are you accumulating $INIT at these levels, or waiting for confirmation?
#INIT #Initia #Crypto

🚨 WALL STREET IS UNDER SERIOUS PRESSURE!
US stocks came under heavy selling pressure after inflation data came in hotter than expected.
Investors are now worried that the Fed may keep interest rates higher for longer.
Here's why this matters:
🔴 Hotter CPI = Inflation still sticky.
🔴 Rate cuts could be delayed.
🔴 Bond yields may rise.
🔴 Risk assets face selling pressure.
And it's not just stocks.
⚠️ Crypto could feel the pressure too.
If the dollar and Treasury yields strengthen, BTC, ETH and other risk assets could face further volatility.
The big question now:
Will this be a temporary panic or the beginning of a deeper market correction?
Keep an eye on Fed expectations and Treasury yields.
#StockMarket #CPI #Bitcoin #Crypto

🚨 QUANTUM COMPUTING COULD PUT 35.4% OF ALL BITCOIN AT RISK.
Imagine waking up one morning and discovering that billions of dollars worth of Bitcoin could theoretically be stolen without anyone knowing the private keys.
Sounds like science fiction?
But there's a real security issue Bitcoin developers need to prepare for.
Here's the story. 🧵👇
Most people believe their BTC is safe as long as nobody knows their private key.
But quantum computing introduces a different kind of threat.
Bitcoin relies on cryptographic systems like ECDSA and Schnorr signatures to protect ownership.
A sufficiently powerful, fault-tolerant quantum computer running Shor's algorithm could theoretically derive a private key from its corresponding public key.
And that's where the problem begins.
1/ Why is 35.4% of BTC exposed?
Recent blockchain analysis estimates that approximately 35.4% of Bitcoin's circulating supply has publicly exposed keys.
That's a massive amount of BTC.
Two major factors contribute to this exposure:
• Around 25.8% comes from address reuse, where previous transactions have already revealed public keys.
• The remaining exposure largely comes from older Pay-to-Public-Key (P2PK) coins, Taproot and other scripts that reveal public keys directly.
2/ Why does address reuse matter?
Think about using the same house key for 10 different doors.
Once someone discovers how to reproduce that key, all those doors become vulnerable.
Bitcoin address reuse creates a similar problem.
When you spend BTC from certain address types, your public key becomes visible on the blockchain.
If you leave additional BTC associated with that exposed key, those funds could theoretically become vulnerable to a future quantum attack.
3/ Can Bitcoin holders reduce this risk?
Yes, in certain cases.
Moving remaining funds from an exposed reused address to a fresh, unused address with a hash-based public-key protection can remove that particular at-rest exposure.
But there's an important distinction:
Not every quantum-exposed coin can be protected simply by changing addresses.
Old P2PK coins and Taproot outputs have different exposure characteristics.
A broader solution will require Bitcoin to adopt quantum-resistant cryptographic standards.
4/ Should Bitcoin investors panic?
Not yet.
There is currently no publicly demonstrated quantum computer capable of breaking Bitcoin's cryptography and stealing these funds.
This is a long-term security challenge, not evidence of an ongoing Bitcoin hack.
However, ignoring the problem until quantum computers become powerful enough would be a serious mistake.
Bitcoin's decentralized nature also makes coordinating a network-wide upgrade challenging.
My final thoughts:
Bitcoin survived exchange collapses, hacks, regulatory pressure and multiple bear markets.
But quantum computing presents a completely different challenge.
The question isn't whether Bitcoin has value today.
The question is whether its security infrastructure can evolve before quantum technology reaches the point where existing cryptography becomes vulnerable.
The next major Bitcoin upgrade might be just as important as its next major price rally.
Would you trust Bitcoin with your wealth if it failed to become quantum-resistant?
#Bitcoin #BTC #QuantumComputing #CryptoSecurity

🚨 BREAKING: US CPI JUST CAME IN HOTTER THAN EXPECTED!
The October inflation report is creating fresh uncertainty across global financial markets. Here's what it could mean for $BTC, $ETH, $GOLD and US stocks.
📊 CPI DATA
• Headline CPI: 0.4% vs 0.3% expected
• Core CPI: 0.3% vs 0.2% expected
• Previous headline: 0.6%
• Previous core: 0.3%
Inflation is slowing in headline terms, but core inflation remains sticky. That's the problem.
🔥 1. BITCOIN ($BTC)
Bearish in the short term.
Higher inflation increases the possibility of another Fed rate hike. That means tighter liquidity, stronger dollar pressure and less appetite for risky assets.
BTC has already reacted negatively, trading around $74K.
If selling pressure continues, expect volatility and further downside risk. A sustained recovery will need improving liquidity expectations and stronger demand.
🔥 2. ETHEREUM ($ETH)
ETH could face even greater pressure.
When liquidity tightens, altcoins and higher-beta crypto assets often underperform Bitcoin.
Watch ETH/BTC closely. If that pair weakens, it could signal more capital rotation away from altcoins.
🔥 3. GOLD ($GOLD)
Surprisingly, gold is also falling.
Why? A stronger dollar and rising Treasury yields increase the opportunity cost of holding non-yielding gold.
Gold dropped around 2% following the CPI release, trading near $4,050.
However, geopolitical uncertainty and long-term central-bank demand could still support gold.
🔥 4. US STOCK MARKET
Not good news for Wall Street.
Higher borrowing costs put pressure on growth stocks, especially technology and AI companies.
Following the release:
• S&P 500 futures: down around 0.8%
• Nasdaq futures: down around 1.4%
• Dow futures: also under pressure.
🔥 5. WHAT ABOUT THE FED?
This is the biggest concern.
Fed Governor Christopher Waller had already warned that a 0.3% or higher core CPI reading could justify considering a 50-basis-point hike in December.
Markets are now pricing an 85% probability of a 25 bps hike and 15% probability of a 50 bps hike.
That's a significant shift in expectations.
📌 MY MARKET VIEW
Short-term outlook:
• BTC: Bearish pressure.
• ETH: Bearish, potentially weaker than BTC.
• GOLD: Short-term bearish due to rising yields and dollar strength.
• US stocks: Bearish pressure, especially tech.
But remember, one CPI report doesn't determine the entire market trend.
The next important signals will be Treasury yields, DXY, Fed commentary and upcoming employment data.
⚠️ My strategy: Avoid blindly buying the dip. Let the market digest the data, watch liquidity and wait for confirmation before taking aggressive positions.
What do you think? Is this the beginning of another major correction, or will the market absorb the inflation shock?
#BTC #ETH #Bitcoin #Crypto #CPI #FederalReserve #Gold #StockMarket

