

Hedge Fund Manager building sports betting models. Nothing to sell. Don’t bet the rent money people!
Cherry Hills Village, CO
Joined November 2022
- Tweets1K
- Following967
- Followers3.3K
- Likes1.3K







I accidentally made a Bloomberg for Pokémon cards…
Bill Benter made about $500 million betting on horses and two years ago it inspired us to start building a statistical model to predict the price of individual Pokemon cards. The market for these cards isn’t efficient like stocks or horses, so the data can tell you how likely cards are to outperform and by how much. The top 10% of cards ranked by our model went up 131% per year and the bottom 10% went down 27% on average over the last 5 years*. The cards’ returns by ranking bucket have pretty high dispersion, but the average return rises steadily as the model’s ranking increases, whether bucketed by deciles or even by 1% buckets.
This was a messy data problem. Long story short, we cleaned 80 million sales, grading population and other records and then trained machine learning models on them, which we’ve been refining ever since. We model future prices for 23,360 cards in four grades (raw, PSA 8, PSA 9 and PSA 10) and predict for 30-day, 90-day and 1 year timeframes, so it is about 280,000 daily predictions... this is overkill, but compute is cheap. I started investing (lol) in cards myself about 18 months ago with an early version of the model. The first card I started buying was Celebrations Pikachu #005 in PSA 10 for a bit over $100 and kept buying up to $500 or so. I have 30 of them and they’re worth about $1,250 each now. The most valuable card I have is a Base Set 1st Edition Pikachu Red Cheeks in PSA 10 that I bought for $13,500 and is worth about $40,000 now. The whole market is up for these things so I got lucky there, but not like this. May have gotten lucky on those two specific purchases too. If you’re still reading and think you’ve stumbled onto an X post that is a money fountain, you have not. All the model does is shift the curve of probabilities, or at least it has in the past.
In the 1980’s and 90’s, Benter digitized paper records of horse racing results by having staffers type them into a computer and applied statistical models to predict probabilities of race outcomes. Today you could replicate Benter’s model easily as the race results are already digitized and the models are free Python libraries, but in the 1980’s the race results weren’t digitized, machine learning was a niche skill, and compute power was very limited (to say nothing of the fact that Benter was the one who thought to do it when no one had before and he knew how). In 2014, statistician Noah Silverman (@noah_phd) made a large improvement to Benter’s model and has been at it since (you should be following him). These guys got me to thinking about other markets were better data and modeling might uncover an edge to make money at decent scale and here we are (ffs). We rent an AWS server for this with 100’s of thousands of times the memory and compute as Benter’s 1990-era laptop and it only costs $1,000 a month or so.
Aside from horse racing, this absurd project started because I had an intern that knew a lot about Pokemon cards. This kid finished undergrad at 16 and is now halfway done with his master’s at an Ivy at 18. He’s really useful to have around. The intern, an engineer from my hedge fund manager and I started building the Pokemon model in early 2025.
The hard part of this was getting the data, cleaning it, engineering features and testing. Everyone that builds sports models should thank their stars that we usually get extremely clean datasets. Pokemon cards come in crazy varieties (we track 41,000 unique English cards) and there are tons of cards that are nearly indistinguishable from one another. Most of the sales data comes from eBay and people describe cards in different ways. After getting normal filtering and mapping as good as we can, we use Jev from @typesafeai to classify difficult cases (millions of difficult cases). Jev is a great tool for very specific use cases.
With clean data we started building the ML models, which have gotten increasingly complex and seem to be at the point of diminishing returns. The overall market is difficult to predict, so our goal has always been to identify cards likely to outperform the market (relative performance I suppose, like mutual fund managers like to lean on). So we built an index and then ended up building 100’s of different indexes.
Early on, I saw news of an Asian hedge fund getting involved and then a Wall Street guy I'm friends with began raising $100mm to buy out a huge collection... this emboldened us to continue. The other two guys talked me into turning all of this into a website, which we did. Then I told them to make it a Bloomberg for Pokemon cards, because I’ve been staring at a Bloomberg for 20 years. We aren’t website designers, so this is a work in progress, but it’s getting there (UI is really hard for bond traders). The other websites and apps didn’t have that data I needed to make my own decisions, so we just kept adding the things I wanted. Now there is a card screener that is like a stock screener, portfolio tracking, and other things like a Relative Rare Gem Rate tool and Gem Rate graphs, calculators for whether a card is worth grading, and tools to find cards that are being manipulated. We also built an MCP server so you can connect it to ChatGPT, Claude, etc. and ask it questions about cards, sets, indexes, your portfolio, etc.
If you’re interested, check it out at the link in the next post. The whole thing is free, but you need to sign in to see predictions or track your collection. Any feedback is appreciated. Maybe one day it will be a business and some features will be paid only, who knows. I really just went along with this for the lols, but I'm into it for an enormous amount of money now.
It goes without saying that this in not investment advice… they’re pieces of cardboard with cartoon monsters on them printed by the billions. The whole market for these could have a huge sell-off.
*This is the penultimate version of the model backtested on out of sample data walked-forward from 2022 to 2026. Returns assume yearly rebalancing and don't account for fees, spreads or limited liquidity, so you probably couldn’t replicate this in the real world.


10
19
55,123

This is the very first thing that made me interested in building sports betting models. Since 2007, all NFL home faves would lose $24,000 with $100 bets. Road dogs only $2,500. I’d be such a good golfer if I didn’t then spend 5,000 hours doing this


Stuff like this is gold. We track many high level stats like this on all leagues we bet.

It's been 4 weeks since the All-Star Break and this view seems to be the most direct link to why home runs are down since then
Avg Exit Velocity on balls hit with 25-35° launch is down about 1 mph. The chart below shows a 21-day moving average. The current point (90.5) is the lowest it's been since 2018.
As mentioned in the quoted post from last week, exit velocity is noisy and can be influenced by lots of things such as simply better pitching, worse hitting, and normal variation/randomness.
The assumption that Ballpark Pal projections are still using is that a new ball was introduced with lower COR, which is producing slower exit velocity off the bat. The timing also corresponds with a reduction in fly ball distance (suggesting more drag) - but that seems to be secondary to the drop in exit velocity.
This explanation seems plausible after an apparent change in late-May which reduced drag on the baseball and lead to farther carry distances. MLB acknowledged that decline in drag as well as a recent manufacturing issue - but says it found no evidence connecting the two together.
The Ballpark Pal model has long assumed that new batches of baseballs are constantly being mixed in, and that each batch has the potential to vary from the previous one. Regardless of whether it's by design or simply due to inconsistencies in the manufacturing process, a key part of capturing the current run environment has been detecting if and when notable changes occur.
The reply to this post has a link to the original story from The Athletic on the apparent ball change in Late-May referenced above

1
6
1,745
My CLV vs my actual ROI. Something I used to try to be careful about, with the goal always being EV without CLV. About 98% of my bets are mainlines and very few props. With the exchanges, it doesn’t really matter anymore. Maybe 1/4th of my bets have been tracked on Pikkit, but the point (and the numbers) remains the same… these exchanges are wonderful (for now but not forever). All recreational bettors should be using them too. I’m somewhat sensitive to problem gambling, as I’ve seen it ruin lives. But the actual cost of a $100 straight bet on tonight’s game at -104 is about $2. If used correctly, it’s really cheap entertainment. It’s $200 to take my family to the movies and $600 to take them to fuxking Benihana. That’s a lot more than $2.

2
25
4,813


This is a good point, but I still contend there’s something here. Look through great pikkit profiles and it’s almost all “tricks” and top down steam chasing. But there are account in there that beat mainlines at the close. Might be 1-2% but they do. I know a few other guys that can do this over huge sample sizes. Recently I’ve been playing with top down on exchanges and I think it’s boring. But I still think there’s a copycat method in here. Today I saw $95k offered at an arb on Kalshi on a college extra game…

I'm not sure why people are ignoring the flaw in the data from @juice_reel here.
The data Juice Reel gathers comes from their users tracking their bets on their site. Sportsbooks have been around longer than Juice Reel. PM's have not.
Anytime you try something new, you are likely to be influenced by small sample size. Lose your first two bets, or 7 of your first 10, and you might sour on the product and quit.😖
When you do that it's as if you're gambling with a ridiculously small bankroll. Your risk-of-ruin is high. You skew the overall results. Nobody wins their first two bets and says "I'm done."🙅♂️
Happens all the time at both regulated books and PM's. If a sportsbook stepped up and provided that data (they won't), their numbers would look similar.📊
Meanwhile the bettors that have that same experience on regulated sportsbooks didn't track that on Juice Reel because in order to even want to USE Juice Reel they were already "established" enough to even want to track their bets. 🧐
In other words, break out that WWII bomber plane pic, this is Survivorship Bias. You're seeing an outsized number of data points of people who have a small sample size influenced by results.✈️
You could also add that the frictionless nature of the Robinhood integration gets a lot more people "giving it a try" than other platforms with higher barriers to entry. They are also more likely to be influenced by results.🤔
1
7
2,810
This is a great podcast. Total gift that you can listen to @LMastro99 talk simulation models for so long.

Spotify: open.spotify.com/episode/3BK…
Apple: podcasts.apple.com/us/podcas…

Anyone have or know a data source for historic NFL play by play that includes defensive formation?
2
1
953
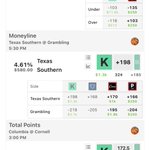
This is very slick software from @EthanAz_ and @BookieBeats1. Also, some guy/firm with $11.6k order on Texas State / Grambling total at Kalshi is probably not dumb money.

3
17
2,094

This is such an important video. I went to the Nuggets the other day with zero edge on the game. But I still gamble sometimes. Right before tip, I max bet $1,100 on the over at Circa and they moved the line up a point. Another $1,100, another point. Did it a third time and another point. A half drunk guy fucking around moved the global total 3 points. If I had built out a system to bet real money, it’d be really really cheap to move lines…. Much cheaper than buying points. Watch this video.
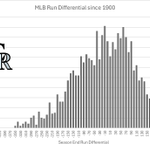
My beloved Colorado Rockies on pace for -510 run differential. This is how bad that is back to the McKinley Administration. Statistically speaking, you would expect this to happen once every 4,000 years. #selltheteam

There are ways to originate bets that don’t require rocket surgery. Most pro betters have found a number of individual angles throughout their careers. Haralabos Voulgaris’ (@haralabob) story is my favorite because he exploited one fairly simple thing to the tune of $100 million (years ago 3 NBA coaches chose to shoot in front of their own bench on the road in the second half, which wildly affects halftime totals and the books didn’t account for this). Many other stories out there.
There are two ways to start this. You can think of an idea and then test it to see if it has been working, or you can identify something that keeps happening and try to understand if there is a good reason for it. Both can work, but the former is generally more desirable. Below is an example I did in Excel (I have no other computer skills).
I’m a huge fan of @ballparkpal (no relationship with them)… it’s about the best $60/year you can spend. I wanted to analyze whether their Park Factors are fully priced into MLB totals (and compare to our own). To do this, I needed to scrape their historic Park Factors (sorry Ballpark Pal). I’m no coder so I asked ChatGPT to help me scrape it directly into Excel. This required installing a couple apps to my computer and changing some Excel options that I didn’t know existed. Then ChatGPT gave me the code for a macro that I copied into Excel and clicked run. It didn’t work, I explained it to ChatGPT and it gave me new code. This worked and in a couple minutes I had an Excel sheet with Park Factors for the last 7,656 MLB games. I added opening and closing totals and odds to the spreadsheet for each game. This whole process took about 30 minutes.
Now, you can analyze it in Excel (ask ChatGPT if you don’t know how) or just give ChatGPT the spreadsheet and ask it to perform the analysis. My historic odds had average juice of 4.76% (equivalent to -110 / -110). Keeping it simple, I looked to see what would happen if you bet all overs when Park Factor’s Runs were positive and all unders when they were negative. This gave an ROI of -1.66% at the closing lines and -0.47% at the open. If you’d bet $100 on each game, you’d lose $12,714 at the closing lines or $3,622 at the open. If lines were perfectly efficient, you’d expect to lose $35,105 betting on those games (taking into account 281 games that pushed). The simple method is still losing money, but this is huge progress… a little line shopping might turn it green. Ballpark Pal is clearly doing something right. There’s no way to know if this holds true in the future and it’s still not beating the juice.
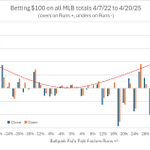
From here it gets a bit more nuanced. If you just bet unders when Park Factor’s Runs are -12% or less, your opening ROI goes to +4.8% and close goes to +4.0%. This is 1,098 out of the last 7,656 games, so it’s a reasonable sample size. It’d be nice if this held true for the highest ≈1,000 positive percent Runs factor, but it doesn’t. Ideally, you’d like to see the chart below follow the “smile” red-dashed line, which it doesn’t. Maybe lines don’t reflect very pitcher-friendly weather but they do for hitter-friendly weather… who knows. The -12% cutoff is arbitrary (data snooping) because it’s just where the most profit is… mostly don’t do this. Also, over that time frame all unders have just performed better (-2% ROI vs -5% for overs)… this has generally been the case with all American sports, except basketball, forever.
[You can/should run some further analysis, such as a Bonferroni or BH false discovery rate tests, split the data, start tracking new data, etc. My point here isn’t to teach a class on statistics or to give some huge edge away (this isn’t), but to show that this can be done fairly easily and quickly. Once you start making progress, it compounds.]
Again, this isn’t the point of the post, but… To drill down further, Park Factors are in relation to MLB average. You will never see a negative Runs calculation at Coors Field or positive Runs for a game in San Diego. So, I adjusted each game’s Runs Factor against that park’s average, hoping for even better results. The 2nd chart is trying to give us the smile that we’re looking for (it’s profitable on both sides now) and it’d be better if you adjusted for overall bias of unders hitting more. The overall ROI declines from -0.47% to -2.29% at the open, but maybe this doesn’t matter because we’d only be looking for games where Park Factors are much higher or lower than usual for that park. You could keep going from here by testing bet sizing against the delta, drilling down on individual parks, etc. You're still kind of driving by looking in the rearview mirror, but it's progress in very little time.
Anyway, think of some ideas and test them. DM them to me if they’re dope!


I got forwarded this question from a friend. $30 to win $50,000! Let’s discuss the utility function of wealth.


Wasn’t planning to come to this city ever again but the hotel has a falconer to keep the birds away from my chips, so I might.

2
9
2,658
This is correct. Aside from the fact very few papers calculate p correctly, 0.05 is completely arbitrary. The ramification of this on all of our lives is extraordinary. Too many insane examples to list.
