

Physicist - ICREA Research Prof. @icreacommunity @icn2nano @_BIST @ls_quant https://xitter.cf/t.co/LAFGCrCIzg #quantumtechnologies #TopologicalMatter #graphene
- Tweets3.2K
- Following4.9K
- Followers10.1K
- Likes53.6K







ALT A topographic image of one of the cluster-decorated Lieb lattices used in the paper. The lattice appears as a series of red dots (iron atoms) arranged in a square cluster-like pattern on a dark blue surface (silver substrate), with several blue dots linked by white lines interspersed within.

ALT Schematic of the spin and orbital Seebeck effects in a vertical multilayer device. An x-y-z axis is shown to the left. From top to bottom (z axis), the layers in the stack are a heater (top yellow layer), SiO2 insulator (green), a gap then Au (yellow), Ti(t) (blue), Ni (yellowy-green), and a substrate (light blue) at the base. The top heater carries a current Idc. Arrows pointing to the right (+y direction) are labeled as currents Jc, while a red arrow labeled Js points up (+z direction). There is a voltage V(H) across the Ni layer. A field H is depicted by a green arrow (+x direction). A vertical thermal gradient (∇T), pointing up (+z direction), generates a spin or orbital accumulation, which is injected from the Ni layer into the detection layers. There are accumulation labels AL A’L near the Ti/Ni interface.


ALT A simulation of plasma accreting onto a central spinning black hole. The black hole appears as a black circle at center; the right side shows particle number density, while the left shows the out-of-plane magnetic field.

ALT A line-art portrait illustration of Francis Halzen with gold accents, created by Niklas Elmehed. Below the illustration, a dark red banner displays his name, "Francis Halzen," along with the award citation: "for decisive contributions to the IceCube Neutrino Observatory and the discovery of high-energy neutrinos of astrophysical origin". At the bottom, text attributes the award to the Royal Swedish Academy of Sciences.

ALT Front cover of the journal Physical Review Letters, Volume 111, Number 2, published July 12, 2013 by the American Physical Society. The top portion features green geometric stripes framing the issue number "111" and the journal title. The center displays a scientific visualization composed of vertical wave-like patterns made of colorful, semi-transparent spheres and spindle-like columns in shades of green, yellow, orange, and blue set against a light cream background.


ALT A visualization of the quantum anomalous Hall effect at an even filling factor (v = 2) in a rhombohedral octalayer graphene/hBN device, along with its intense competition with other surrounding correlated insulating states. In the middle is a 3D rendering of the device structure. A moiré superlattice, consisting of eight stacked layers of hot pink spheres, is sandwiched between two thick, inner light pink and light blue hBn dielectric layers and two thin outer light purple graphite top and bottom gates. A curtain-shaped color contour map, which represents anti-symmetrized Hall resistance (Rxy) as a function of v and displacement field, frames the 3D rendering with thick symmetric blue and red curved lines under marbled patterns of red, white, and blue.


ALT A micrograph of metamaterial architecture (purple) with repeating cross-shaped elements and circular nodes, and the connecting arms fabricated by through-wafer deep reactive ion etching, with a scale bar showing 1.8mm.


ALT Scientific illustration of the signature of the fractal Hofstadter butterfly in the measured electrical conductance of a graphene-hexagonal boron nitride heterostructure.


ALT A two-by-two grid of illustrations that demonstrate the difference between the quantum metric and Berry curvature. Each panel maps a two-dimensional, two-level system onto the Bloch sphere, with the Bloch sphere on the right side, and two mirrored, rounded cones representing the two-level system on the left side. The left panels show a visual representation of how the quantum metric measures the distance between two states on the Bloch sphere, and the right panels show a visual representation of Berry curvature corresponding to a mapped area on the sphere. The top two panels are atomic insulators, and their cones are separated by a small distance; the bottom two panels are topological insulators, and their cones slightly overlap.

ALT A schematic demonstrates an unconventional superconductor robust against disorder. Two purple spheres represent Cooper pair electrons scattering off an impurity represented by a black sphere on a square lattice. The lattice is separated into blue and orange regions, which are conventional and sign-changing, respectively. Arrows representing the scattering are smaller in the orange region than the blue region.

ALT A schematic of the shot-noise measurement shows a DC current injected along the edge of a circuit, propagating through various circuit components before current fluctuations are measured at an amplifier contact.

ALT The phase diagram of a Haldane chain with temperature on the Y-axis and magnetic field on the X-axis. A flattened, upside-down parabola covers the Bose-Einstein condensate phase — the low-temperature area between two critical magnetic fields — the border of which marks a phase transition. Another parabolic shape starts and ends at the same spots on the magnetic field scale, but goes slightly higher in temperature, indicating the Tomonaga-Luttinger liquid phase. A “V” shape originating at the two critical magnetic field points and bordering the Tomonaga-Luttinger liquid phase shows quantum-critical regions. At high temperatures, the system is paramagnetic.
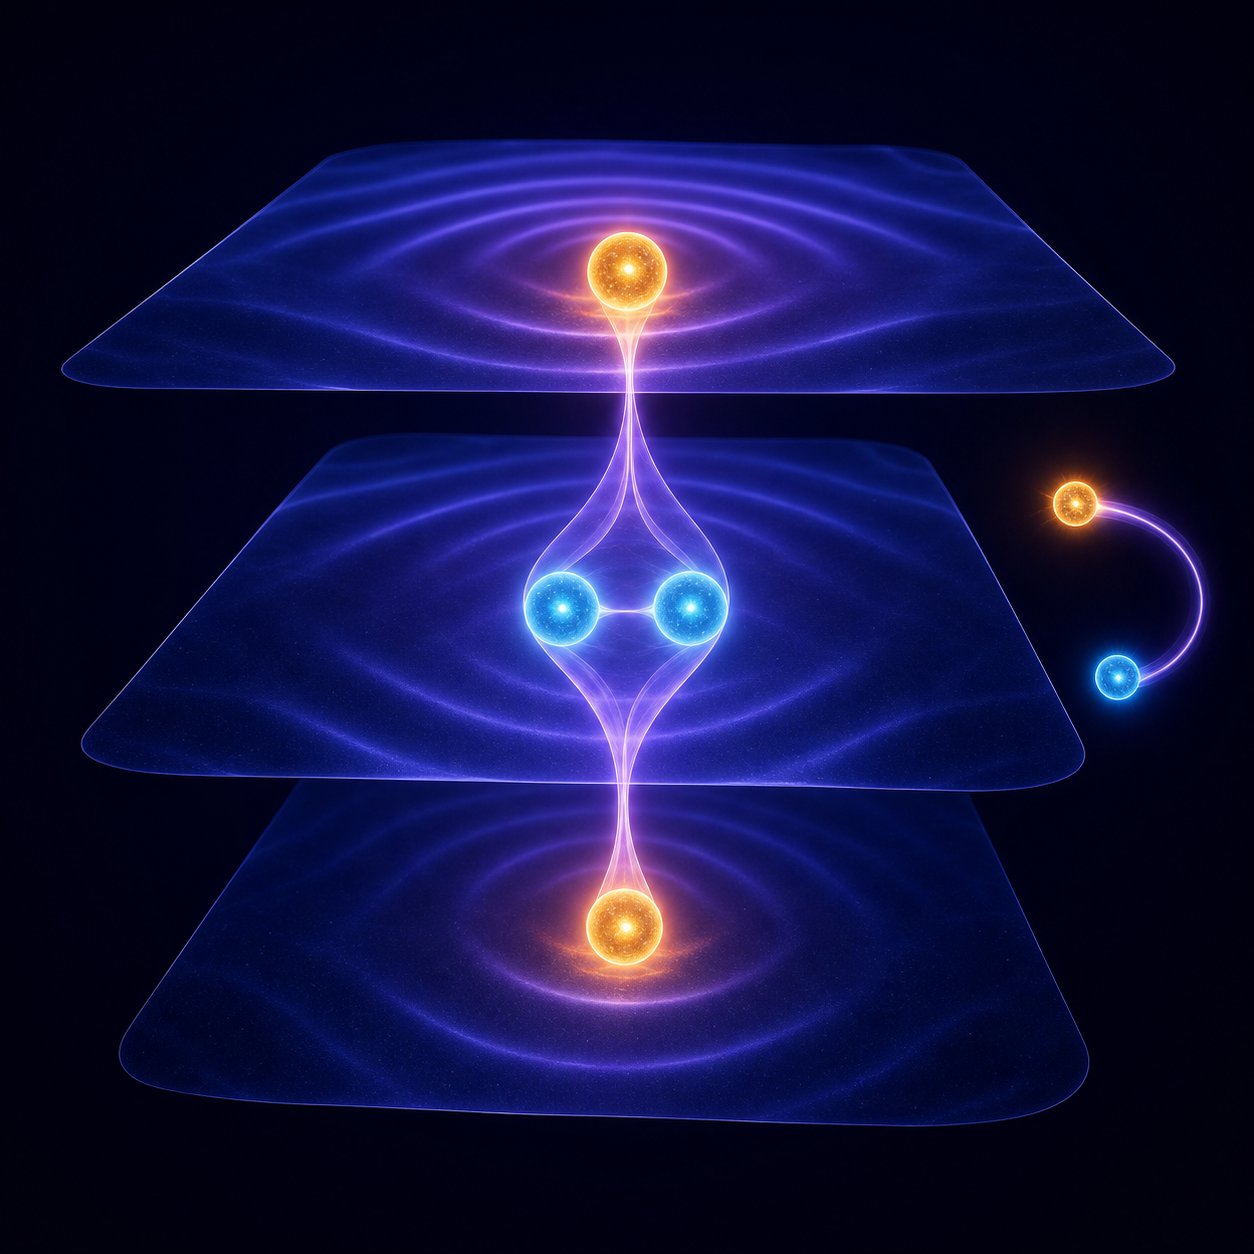
ALT A 3D rendering of three stacked quantum Hall layers linked by a coherent anyon-exciton composite, with fractionalized quasiparticles following a curved path beside the layers.

ALT A purple displacement vector points from an electron to a hole at the center of a hexagonal lattice, and blue vector indicates the particles' upward momentum. Red arrows at each of the four corners of the image show the Berry curvature.