

AI market structure intelligence. Layers that map structure, momentum and trend - and Prism, the AI assistant that reads them all. https://teapawt.net/t.co/3w30YT59VP
Global
Joined April 2025
- Tweets1.9K
- Following169
- Followers886
- Likes880



Pinned Tweet
One chart. Three people. Three questions.
Trader: is this chart worth my attention today?
Advisor: what do I tell my client on Monday?
Portfolio manager: which of my names changed state?
Seven layers, one job each. No prediction - the structure.
3
23,473
An index can take a level back before most of the stocks inside it do.
The headline is about the index.
Check the parts before you trust the whole.

1
36
Crossing under the average everyone watches takes one session.
Spending weeks under it is a different story.
Most of today's headlines are about the first one.

91
Great quarter, red stock. Both can be true.
The report grades the company. The price grades what was already expected of it.
Only one of them is on your chart.

87
Sunday night is a thin room.
The first move after a weekend headline mostly tells you who was awake. What the market actually thinks shows up once everyone's back at the desk.

107


A hard week. So we didn't open one chart - we opened twenty.
One map. Twenty markets. One question for each: where in its cycle does it sit right now?
Condition, not signal.
1
144
The Structure Map - free, updated every Monday: structuramarkets.com/structu…
Full read: structuramarkets.com/read/tw…
65
The Mag 7 after their biggest one-day drop since April 2025 - ranked by structure, not headlines.
One ruler: distance from the weekly line.
$MSFT +23.0%
$AAPL +15.3%
$AMZN +14.2%
$TSLA +10.6%
$NVDA -6.3%
$META -7.6%
$GOOGL -15.6%
The structure layer printed on two of them. Neither is near the top.
1
214
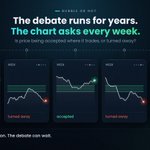
Bubble or not - that debate can run for years.
The chart asks a smaller question every week: is price being accepted where it trades, or turned away?

149
From the comments: "What's the name of the indicator?"
It's not one indicator. It's four layers - each answers one question:
Structure - where is positioning built? Accumulate
Momentum - is the move still being pushed? Horizon
Trend - turning or fading? Pulse
Scan - which chart to open? Sentinel
Accumulate, Divergence, Blocks and Adaptive are free on TradingView and TrendSpider.
173
A day like Thursday fills the whole intraday chart and shows up as one bar on the weekly.
Before reacting, decide which chart you actually trade.

134
Five moving averages give you five opinions.
Structura Adaptive draws one line and lets the market set its speed: it bends with price in a trend and lies flat in a range.
Flat isn't a warning. It's the read: no trend.
161
The setup that worked all through the last leg is the one you'll keep reaching for after the market changes.
Read the structure you have now, not the one that paid you last time.

120