

Any pronouns. I play Magic the Gathering! Strongest Defender of Arimura Mao's stupid mushroom hair Feel free to directly message me on discord: tabbune
Joined August 2020
- Tweets10K
- Following1.1K
- Followers440
- Likes63.7K




Pinned Tweet
Gakuen Idolm@ster Producer Demographics Survey Result
Thank you to all producers that participated! I have received a staggering 2000+ responses for this survey, and in this thread I'll be sharing the results
本当にありがとうございました


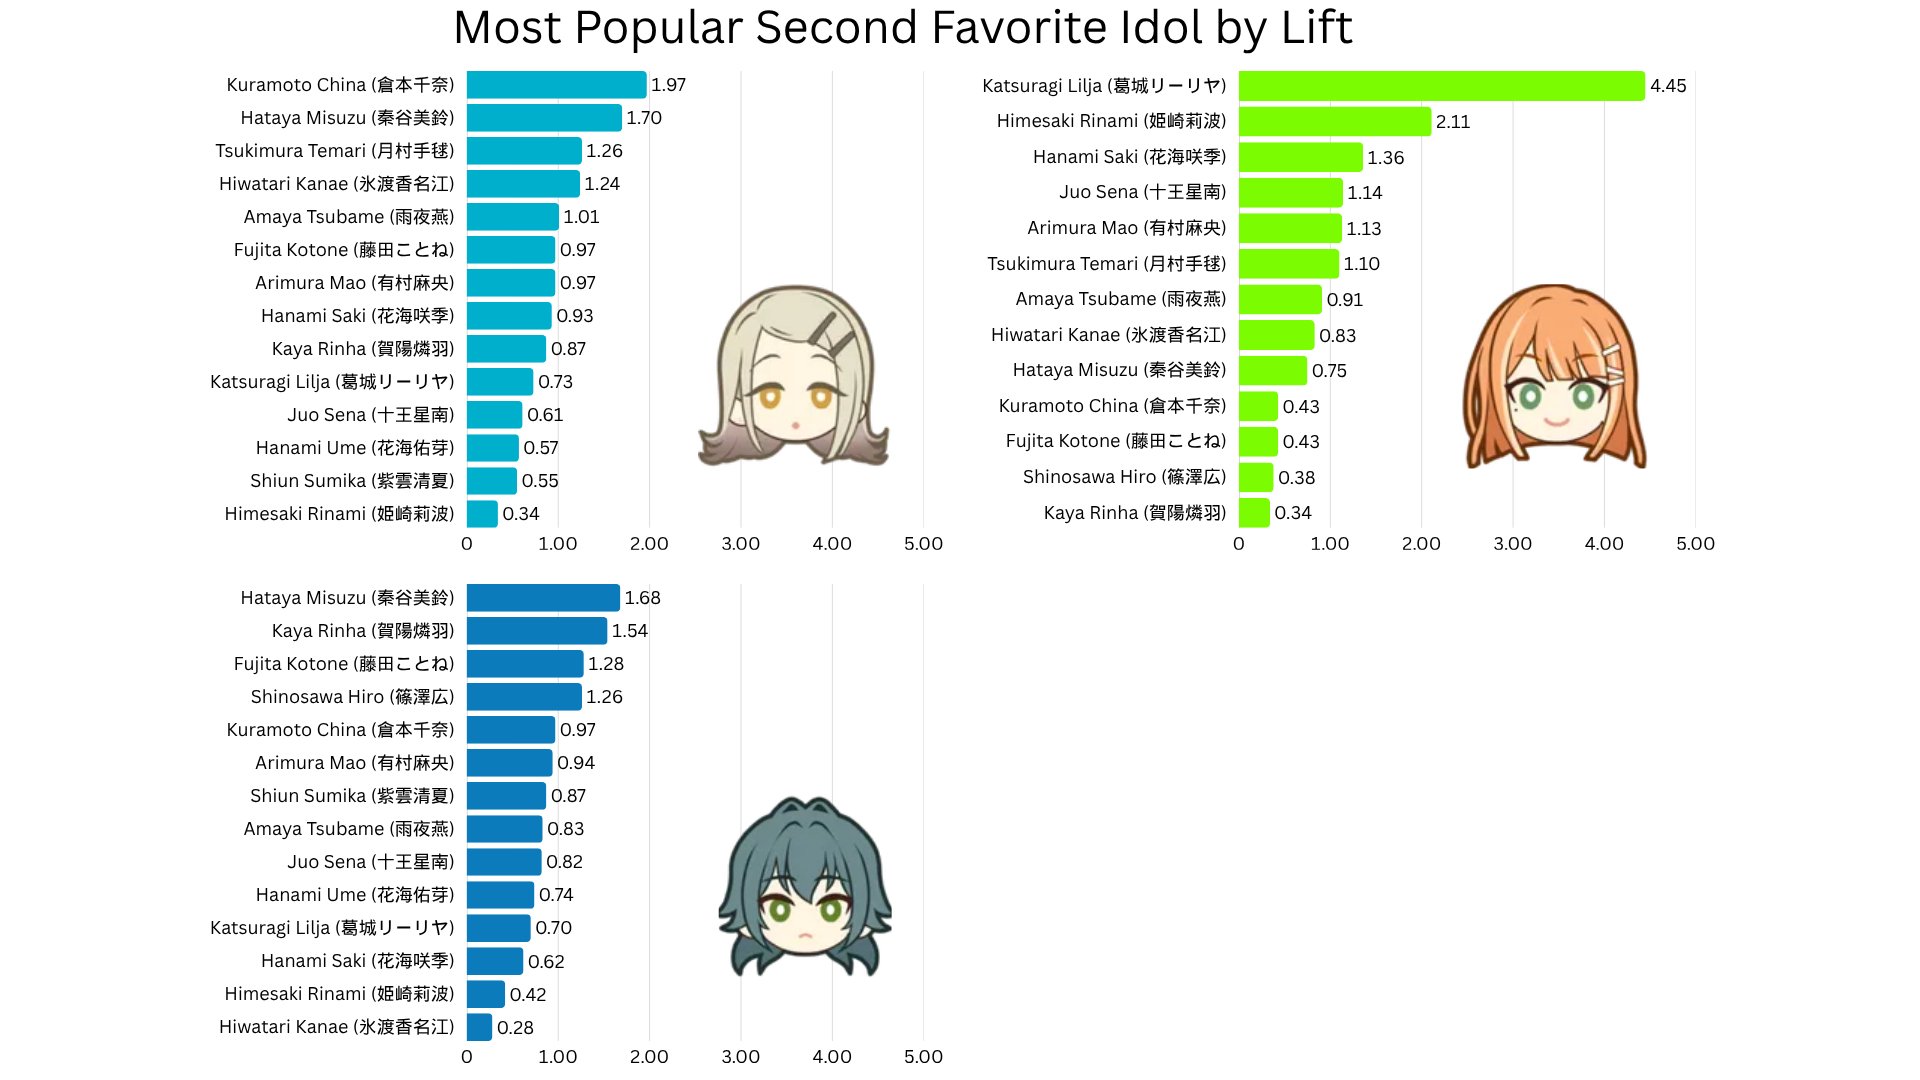
Okay I'm mad at myself for including the raw ratio for second favorites per idol now
People aren't reading the Lift section which is a more helpful metric for who tends to like who
I am doing a short survey on Gakuen Idolm@ster producer demographics!
forms.gle/KQemifApHXQnCNCP8
This form will be open for one week, and I will be sharing the data after. Please help by filling this form and sharing it. Reposts are very appreciated!

Link to the results: teapawt.net/TabbuneBot/status/2124…
Gakuen Idolm@ster Producer Demographics Survey Result
Thank you to all producers that participated! I have received a staggering 2000+ responses for this survey, and in this thread I'll be sharing the results
本当にありがとうございました
1
94
First and Second Favorite Idol Correlation
With the first and second favorite idol data, we can find out which other idols are popular among specific Producers. The following are charts for the most popular second favorite idols within producers of each idol, by raw ratio:


I FORGOT TO CHANGE LILJA'S COLOR IN THE OCEANIA CHART RRREEEEEEE
in my defense her image color is actually really hard to see with a white background
Regional Popularity
There are some differences in the most popular idols between different regions, here are some of the more popular idols within regions with a more statistically significant amount of respondents:


9
864
In the second chart, I've grouped the idols into Female Leaning, Relatively Even, and Male Leaning based on the difference between male and female producers. It should be remembered that the overall dataset leans 53/40/7 in terms of gender

Tabbune | Gakumas Survey in Pinned! retweeted

アンケート結果にアメリカが多いことは調査対象者の言語に囚われており、偏りが存在することの証左だが、それを抜きにしても大規模な調査であり、今最も信頼に足るサーベイの一つとなりうる。

"the charts look ugly!"
unfortunately the survey was done by a math nerd, not a graphic design nerd
"your data is bad + biased + L + ratio"
The bar was chatGPT hallucinations and I'm proud to say I could at least clear that
2
7
94
also I have zero idea how to get the results into the JP twt algorithm again. Getting 600+ japanese respondents was already a fucking fluke lmao
1
3
298
Even in my stats report they are making out with each other 😭


The Full Analysis can be accessed via this google doc:
docs.google.com/document/d/1…
Thank you for reading this far, and thank you for your participation.
お疲れ様でした

