

@TechCharts
🇧🇬Account based in
About this account
- Account based in
- Bulgaria
- Connected via
- Greece Android App
Account-level information from X, not a live location or the device used for a specific post.
Chartered Market Technician (CMT) and Classical chart trader. Ex-Fund manager. 📈 ➡️ https://xitter.cf/t.co/VSwr0eryIS 📺 ➡️ https://xitter.cf/t.co/XFZI3RE8aj
Plovdiv, BULGARIA
Joined May 2011
- Tweets45.8K
- Following453
- Followers191K
- Likes14K




Pinned Tweet
Consider TechCharts Membership- Weekly Global Equity Reports, breakout alerts, Educational Video - Classic Charting. blog.techcharts.net/


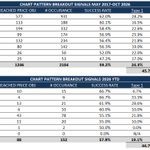
#TECHCHARTSMEMBERS Breakouts page and pattern reliability numbers are updated.
blog.techcharts.net/breakout…

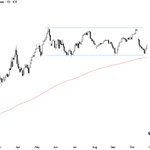
Here is why I think #SILVER's test of support area is very important. A cluster of technical supports between 50-55 area.


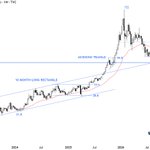
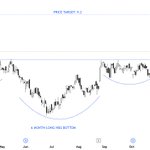
From the latest #watchlist, a H&S bottom with a possible rectangle as the right shoulder.
#TECHCHARTSMEMBERS
Access >> tinyurl.com/bp7ms2kf

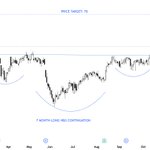
#TECHCHARTSMEMBERS I featured this text-book H&S continuation in the latest report. Getting ready for pattern completion.
Access >> tinyurl.com/yr24mvh2

Aksel Kibar, CMT retweeted

6th edition was published by the McDermotts of Boston and is pure. The 7th is when the counterfeit begins

Aksel Kibar, CMT retweeted
Last Monday members of TheFactorReport service were alerted to a pending up-thrust in the price of Brent North Sea Crude.
Would this have been useful to you? See report here
peterlbrandt.com/factor-spec…
Become a member here
peterlbrandt.com/#av_section…


Aksel Kibar, CMT retweeted
$RDVY - First Trust Rising Dividend Achievers ETF daily chart formed a 3 month-long H&S top.
If it breaks out above the right shoulder (80.43), the pattern acts as a top failure. If it breaks below the neckline (78.44), the pattern acts as a top reversal.

Log vs. Linear scale charting. I prefer Log scale.
blog.techcharts.net/2017/08/…

Aksel Kibar, CMT retweeted
Over the past 10 years Tech Charts compiled live breakout alerts on these 8 classical chart patterns. Out of those #rectangle has been the most robust. Frequency and success rates. Also number of Type 1 breakouts have been the highest with Rectangles.
Interested to learn more >> blog.techcharts.net


Aksel Kibar, CMT retweeted
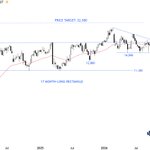
#TECHCHARTSMEMBERS Latest Global Equity Markets report featured the rectangle setup inside the cup & handle continuation. There are two patterns that can breakout to all-time highs.
Access >> tinyurl.com/4n8uyns4
