

Finding high quality Gold & Silver stocks w/ 5 to 10-bagger potential Master of Financial Technical Analysis 16 Years Married to my best friend, the best wife.
Free Copy of My Book 👉👉👉
Joined November 2009
- Tweets8.7K
- Following489
- Followers32.4K
- Likes16.5K




I agree with Patrick's analysis but disagree with the characterization of "sobering."
A 67% gain in Silver in 2 years is not sobering.
It would be an excellent outcome.
Even accounting for significant cost inflation, NPVs would at least double from here.
That doesn't even include a breakout.
2 years or 2.5 years...still very good.


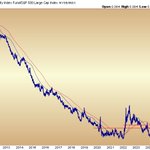
The sharp rebound in the S&P 500/Gold ratio is a countertrend move.
Still below its falling 20 and 40 month MAs, with lower highs and lower lows since late 2021.
The next peak and rollover sets the stage for a monster move in precious metals.

A common charting mistake is forcing trendlines (and triangles) onto trends that are no longer valid.
Silver went parabolic, then busted, as is normal. The 2025 uptrend is gone. Connecting those old points doesn’t mean there is a viable trend.
Horizontal levels are what matter. Stop forcing trendlines!


Gold’s Daily Sentiment Index (DSI) is at a bearish extreme.
It’s unclear whether he used the raw reading or a moving average. My guess: the latter. The often-quoted raw DSI isn’t actionable, but a 15 or 20-DMA does work well.


Respectfully, the only thing religious was your adherence to conventional CoT analysis and failure to understand nuance.
I pointed out by your own metric that positioning was similar/slightly higher in late 2005 and late 2009 and that did not produce a big drop in price.
You have to adjust parameters when you are in a secular bull market.
Furthermore, trading has moved away from the Comex which is why Open Interest has plummeted and your data looks extreme.


People are so obsessed with the 2008 boogeyman that they now blame every Gold decline on “liquidity” and treat it as proof the stock market is about to crash.
Real interest rates, Gold’s primary driver, are at 19 year highs. The yield curve is flattening. The Fed has begun tightening, and financial conditions have tightened too.
That is bearish for Gold, but it is temporary. Much has been discounted already.
This is the major decline in Gold and Silver you're so worried about. It started in February. It's almost over.
You just cannot see it if you still have 2008 brain.

The bond market is crashing.
Gold and silver are crashing.
Yet the stock market has remained steady.
How does that make sense?
Is the stock market predicting that so much liquidity will be added to the system that stocks eventually “crash upward”?
If so, why are gold and silver falling?
Someone is wrong.
It’s well known that bond traders are more sophisticated than stock traders.
What’s less appreciated is that precious-metals investors are even more discerning than both.
While gold has been selling off, ETF flows have quietly been moving in the opposite direction.
The market can ignore this divergence for a while.
But eventually, fundamentals assert themselves.
When the dust settles, those who understood the value of precious metals early will be the ones who emerge with the greatest fortunes.
Thursday 🧵
Fed tightening has begun, and metals and miners have weakened.
Miners had been crushing the metals but that strength is now being tested.
What comes next for Gold and miners?
Let’s break it down.
Let's Go!
7) Summary: Putting it all together
Short-term trend is down as metals and miners look to make the "start of the rate hike cycle low."
Gold volatility should remain low for months and this makes sense during the rate hike cycle.
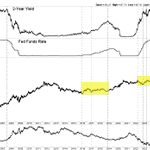
The major fundamental development to look for is a peak in the 2-year yield, which will signal an end to the rate hike cycle.
Look for Gold to make a low this month and a higher low in winter as the market sniffs the rate hikes are done.
We are watching breadth indicators daily as they will signal the next low-risk buy in miners.
8) Thank you for reading!
Kindly like and retweet if you think someone else would get value from this thread.
Looking for high-quality junior gold and silver stocks with genuine 5x–10x upside potential? Now is the time.
thedailygold.com/premium/

Gold & Silver are going vertical (over a 2-3 year period) when this happens.

.@42Macro founder Darius Dale (@DariusDale42) on when the AI bubble bursts:
"AI is already too big to fail. So whenever it does fail, prepare for a spectacularly long and spectacularly deep bear market."
"We think it's a very high probability that this market cycle ends in one of the worst bear markets in U.S. history."
Equal-Weighted Commodity Basket vs. S&P 500
Commodities are beginning to emerge from a big multi-year base relative to the S&P 500.
If this breakout develops as expected, it would signal that the secular bull market in Commodities is still in its early innings.

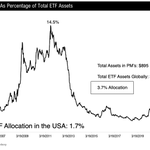
This four-year-old chart shows the implied global allocation to precious metals. I updated the current reading today using publicly available figures.
2011 peak: 14.5%
Current global allocation: approximately 3.7%
USA allocation: only about 1.7%
Even after the recent strength, precious metals remain materially under-owned, at only a fraction of 2011 peak.

The first hike of a new Fed tightening cycle marks a low in Gold when Gold weakens into the decision.
The bigger signal comes when the 2-year Treasury yield peaks.
After the last three peaks in the 2-year yield, Gold surged:
+215% in 2.3 years
+78% in 1.8 years
+63% in 9 months

Want to find the next 5x or 10x winner? Follow along.
thedailygold.com/premium/