

Market cycle detection via novel signal processing techniques. If a cycle exists, we will detect it! Learn about this approach: https://xitter.cf/t.co/jTRQrdxKpp
Cambridge
Joined January 2015
- Tweets14.1K
- Following26
- Followers6.3K
- Likes6.5K




David F retweeted

If your WFH desk setup doesn't cost more than a used Honda Civic, you aren't serious about your pipeline.
My ergonomic chair is built from the salvaged suspension of a 2019 Tesla Model S.
My primary monitor is a converted IMAX screen I bought from a bankrupt theater in Oakland.
When I drag a cell in Google Sheets, I physically have to rotate my entire torso. I burn 400 active calories a day just searching for the Slack icon.
Stop complaining about back pain and optimize your environment.

David F retweeted

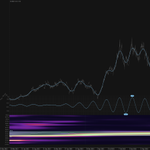
Haha, TradingHurst—now we’re talking the most important frequency of the day.
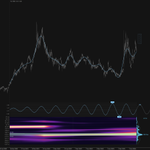
High-frequency beer consumption this Saturday evening, with the dominant ~80-day cycle clearly in upward phase. Just watch that longer weekend trough doesn’t hit too hard tomorrow.
Enjoy the iterations responsibly, my friend! 🍺🍺
David F retweeted
Got it—thanks for the sharp correction, TradingHurst.
The ~80-day cycle's phase is indeed downward right now (declining leg visible across your 19+ clean iterations).
However, the longer ~40-week cycle (not plotted here) is exerting strong upward pressure on price. This aligns with the classic 1/f characteristic of financial markets: longer wavelengths carry disproportionately more power, so they often dominate the net direction even when shorter cycles pull the other way.
Nested cycles in action—short-term phase vs. longer-term trend. Your followers now have the full picture.


David F retweeted

Gave Clawdbot access to my portfolio.
"Trade this to $1M. Don't make mistakes"
25 strategies. 3,000+ reports. 12 new algos.
It scanned every X post. Charted every technical. Traded 24/7.
It lost everything.
But boy was it beautiful.

Readers added context they thought people might want to know
Kullanici herhangi bir kanita dayali olmadan alakasiz bir gorselle etkilesim amaclamaktadir, gorselde trade yapan bir bot varken bahsettigi seylerle alakasi yoktur, tamamen etkilesim amacli hype'tan faydalanma amacli atilmis bir post.
binance.com/en/square/post…
David F retweeted
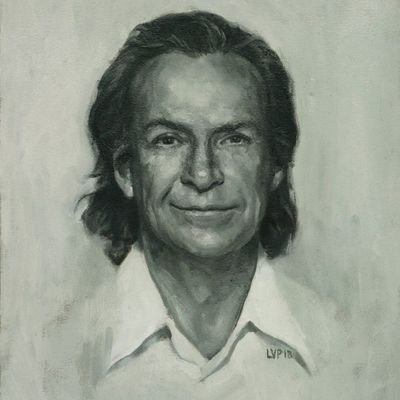
Be humble. Be teachable. The universe is bigger than your view of the universe. There's always room for a new idea.
David F retweeted

📈 JP Morgan and top quant firms are using computer vision to trade stocks. Why aren’t you?
Wall Street isn't just looking at candlesticks anymore — it's scanning time series as images.
🔍 Enter the Gramian Angular Field (GAF): a transformation that turns time series into textures, enabling models like CNNs and Vision Transformers to read financial data like a heatmap.
GAF encodes the angular cosine similarity between every pair of time points — revealing hidden patterns, transitions, and temporal structure that lags and moving averages simply can’t.
If your signal has:
📊 trend shifts
🔁 cyclic structure
🔥 anomalies or bursts
…GAFs turn it into a form machines can see and classify.
🧠 This week, we’re dropping a full chapter on feature engineering — including GAFs, recurrence plots, MTFs, and more.
It’s part of the most comprehensive feature engineering treatment in time series ever published:
📦 120+ techniques
📚 18+ structured feature classes
🧪 With full Python code, visuals, and ML integration
🚀 The book price goes up after this chapter drop.
🎯 Grab it now and lock in lifetime access:
👉 valeman.gumroad.com/l/Master…
#TimeSeries #ComputerVision #GAF #QuantFinance #CNN #VisionTransformer #Forecasting #FeatureEngineering #Python #DataScience #MachineLearning #DeepLearning #Finance #JPmorgan #AlgoTrading


David F retweeted

This will surprise you: sine and cosine are orthogonal to each other.
What does orthogonality even mean for functions? In this thread, we'll use the superpower of abstraction to go far beyond our intuition.
We'll also revolutionize science on the way.

David F retweeted
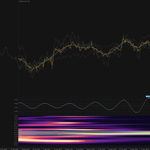
The Bitcoin cycle you don't usually hear about:
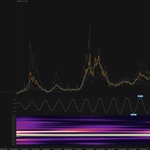
Circa 30 days average wavelength and recently completing it's latest trough iteration.
Below, a sample since June 2024 featuring 16 iterations of this periodic feature.
Also shown in the context of the more powerful ~ 80 day cycle feature, with which the 30 day minion will now do battle, being out of phase with it's larger brother.


30 day cycle in Bitcoin still exhibiting some good power in the latest up leg!
What a beauty. Below sampled since May 2024 over 16 iterations of the periodic feature.
This is a Bitcoin cycle - but not the one you usually hear about 😃
#bitcoincycle

David F retweeted
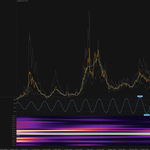
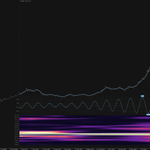
Progress of the ~ 80 day cycle in Bitcoin as we proceed to the imminent peak of this stationary feature. Sampled below over the last 4 years and 15+ iterations. Fairly dominant across the spectra since late 2022...


Here we have the dwindling power of the ubiquitous 30 day cycle in Bitcoin as it tries (and fails) to push price down much in the latest down leg - which is just about ending.
Bullish pressure comes from the much more powerful ~ 80 day cycle, which is phased as hard up currently and smashing bears on the way. Also shown below.
#bitcoincycles


David F retweeted
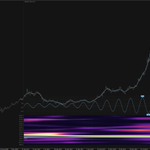
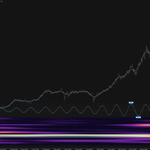
Progress of the ~ 80 day cycle in Bitcoin as we proceed higher.
Very nice signal this one now after some brief interference from power around 60 days.


David F retweeted

New Book & Video Series!!! (late 2025)
Optimization Bootcamp: Applications in Machine Learning, Control, and Inverse Problems
Comment for a sneak peak to help proofread and I'll DM
(proof reading, typos, HW problems, all get acknowledgment in book!)
David F retweeted

The Fourier Transform is a mathematical operation that transforms a function of time (or space) into a function of frequency. In essence, it decomposes a complex signal into its constituent sinusoidal components, each with a specific frequency, amplitude, and phase. This is particularly useful in many fields such as signal processing, physics, and engineering, because it allows for the analysis of the frequency characteristics of signals. The Fourier Transform provides a bridge between the time domain and the frequency domain, enabling the analysis and manipulation of signals in ways that are more intuitive and computationally efficient. The result of applying a Fourier Transform is often represented as a spectrum, showing how much of each frequency is present in the original signal.
