

Tweets are not financial advice 👉 https://teapawt.net/t.co/P8YzisgMbq 👉 https://teapawt.net/t.co/ZZDR4ZjhrL
Joined May 2021
- Tweets14K
- Following185
- Followers7K
- Likes4.6K




Pinned Tweet
Join My Official Network Links:
📮Telegram
t.me/tradingpuzzles
📮Direct Contact
t.me/KlejdiCuni
📺Youtube
youtube.com/@TradingPuzzles
🐥Twitter
teapawt.net/TradingPuzzles
📈TradingView
bit.ly/3hwP4eJ
🌐Website
tradingpuzzles.net/
#DXY -US Dollar Index before FOMC Minutes - Channel Pattern
On the daily chart, DXY reached the upper boundary of a large, strong channel pattern.
Once price reached this area, we could see that price had started to react. We could be near the top of the move for DXY, pointing to further correction or a bigger drop.
The FOMC minutes may not share anything interesting tomorrow. They may reiterate that they are happy with the current interest rate and will probably focus more on the upcoming data. This could create a weaker USD and DXY could fall.
I think it could call at 102.6, 101.5 and 100.7
Why DXY was strong all these days, I have no clear idea because it was the same old speculative theme that the FED will raise rates. This is a very old theme that made no sense in my opinion, but let's see.
You can find more details on the chart.
Thank you! 🍀
⚠️PS: Do your own analysis and use your own strategy to join the trade.
#DXY @TradingView #forex #forextrading #forexanalyssi #usdollarindex
tradingview.com/chart/DXY/WX…

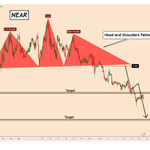
📣#NEAR - Posted on 03-Nov-2026 📈
🎯Target_1 reached 🔥😁
✅PS: It bearish yet but looks like it is losing the bearish momentum.


📣#NEAR: Head & Shoulders Signals Further Downside to 2.4
NEAR broke out of a large Head and Shoulders pattern. The pattern so far looks clear. Today will be a mess with the US midterm elections, so we need to be careful.
If NEAR moves near the neckline of the 4.30 pattern, it could be a good area to watch to sell NEAR.
If you already have it open, then hold it as it could fall further to 3.35 and 2.4.
You can find more details on the chart.
Thank you! 🍀
#crypto #cryptotrading #cryptoanalysis

2
475
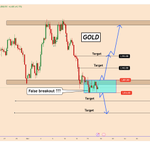
#GOLD: Bearish Breakdown or Another Trap?
Last week, Gold fell from a very strong support area near 3870, showing a clear bearish confirmation after that strong bearish confirmation.
Days have passed, and Gold has not fallen any further. This is not a normal situation after such clear setups.
The current 4-hour setup is bearish to be clear on this topic.
I tried my best and isolate the risk more considering that it is showing a small correction.
If the price moves above 3889, Gold may start moving higher, as the bullish scenario is emerging with targets at 3940 and 3950.
If the price moves below the small correction at 3834, then it should fall to 3800 and 3750.
You can find more details on the chart.
Thank you! 🍀
⚠️PS: Do your own analysis and use your own strategy to join the trade.
#XAUUSD @tradingview #forex #goldtrading #goldanalysis #goldsignals #trading #investing #goldinvesting
tradingview.com/chart/XAUUSD…

3
19
2,525
📈BEFORE THE BELL 🔔
🟢US stock index futures fell as investors awaited embattled chipmaker Nvidia's earnings as a test of the AI trade, after fears of slowing data-center spending and higher borrowing costs fueled a sharp selloff in recent weeks.
1
2
735
🟢Meanwhile, the dollar steadied after traders pared back expectations of a super-sized rate hike by the Federal Reserve next month. Comments from Fed officials could sway money markets, with Chris Waller, Beth Hammack, Alberto Musalem and John Williams due to speak later in the day.
1
108
#USDJPY: Buyers Defend 159.00 Ahead of FOMC Minutes
USDJY currently tested the structure area located near 159.00
The pattern remains valid and bullish. The support area near 159.00 looks strong so far and the price has already started moving.
Tomorrow we have the FOMC minutes and that is the only risky part. If all goes well and we don't have any surprises from the FOMC minutes tomorrow, then USDJPY should rise further as shown in the chart
Upward targets:
160.15
161.00
162.00
You can find more details on the chart.
Thank you! 🍀
⚠️PS: Do your own analysis and use your own strategy to join the trade.
#USDJPY @tradingview #forex #forextrading #forexsignasl #forexanalysis #trading #investing
tradingview.com/chart/USDJPY…

4
611
INJUSDT: Bearish Head and Shoulders Pattern
INJ/USDT completed a bearish head and shoulders pattern, thus indicating that a downtrend may begin soon.
INJ is a bit of a laggard compared to other altcoins. The price has made a strong breakout and is likely to fall further.
Downward Targets:
5.43
4.07
3.15
BTC also remains in the bearish zone, creating bearish conditions for all altcoins in general.
You can find more details on the chart.
Thank you! 🍀
⚠️PS: Do your own analysis and use your own strategy to join the trade.

🗓 Economic Calendar - What to Expect Today 16-Nov-2026❓
🇯🇵JPY Gross Domestic Product(Q3) Prel
Japan reported a decline in preliminary GDP data, but the JPY was very strong and remains strong in a strange way. Only the BOJ and the US know this part and maybe they are already manipulating the strength of the JPY from last week because the JPY was strong for no reason.
🇨🇳CNY Retail Sales and Industrial production
The data from China was all very bad and this is creating a weaker USD today.
The economic calendar during the London market is empty.
🇨🇦CAD Consumer Price Index
The only important data during the US market open is the Canadian CPI data. It is possible that it will be higher than expected and we could have a stronger CAD.

2
729
#Silver confirmed further declines on a quiet day
Silver broke out of a strong structural area near 49. The price made a strong close indicating strong bearish momentum.
As long as the price stays below this area, the chances of further declines remain very high.
I think it could reach 45 and 43 this time.
I don't think it can be supported from a fundamental perspective, but these are the movements of the metal so far without strong reasons, news or data.
You can find more details on the chart.
Thank you! 🍀
#silvertrading #silveranalysis #silverinvesting

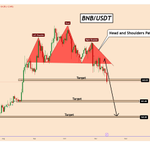
📣#BNB - Posted on 30-Oct-2026 📈
🎯Target_1 Reached 🔥😁
✅After almost 2 weeks BNB decided to make a decisive movement and reached the target in a clear way. Considering that the candle is very long and bearish the odds are to fall further.
Keep it with stop loss at breakeven for the other targets.

#BNB Picture After Binance Was Hacked
BNB completed a clear "Head-and-Shoulders" pattern.
The price has now broken out of the neckline of the pattern, indicating further declines.
I expect the price to fall below:
660
603
560
I don’t like to short BNB because it often acts aggressively on the upside.
However, this time is different and we need to be careful.
Binance was hacked, putting the crypto exchange’s custody risk back in focus.
Binance is investigating a major security incident after billions of dollars in crypto assets were moved from wallets linked to the exchange.
Analysts react as Binance freezes assets following a $6.3 billion security breach - source Reuters
You can find more details on the chart.
Thank you! 🍀
⚠️PS: Do your own analysis and use your own strategy to join the trade.
#BNBUSDT @TradingView #cryptotrading #cryptoanalysis

6
991
#EURUSD: Share Your Opinion...Can This Move Happen?
Over the past two weeks, EURUSD has created several clear and bearish positions. The price made a clear close below the structure as you can see and moved back up.
Also yesterday gold fell because of the speculations that the FED may raise interest rates in December meeting. The problem is that the news was released on Tuesday and nothing special happened.
Yesterday, when the US market closed, we saw the USD and CAD start the day strong and did not stop. Why?
On the last FOMC meeting that was only 2 weeks ago, the FED Chairman also made it clear that the FED is happy with the current IR and does not want to change the IR at the moment. They want to see more data. I don't think we had anything special about the USD strength yesterday.
⚠️The current EURUSD setup is definitely bearish, but I think that it has a chance to repeat the same bear trap
What do you think?
You can share your opinion below in the comment section
#EURUSD @tradingview #forex #forextrading #forexsignals #trading #investing
tradingview.com/chart/EURUSD…

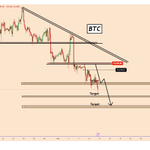
#BTC: Bearish Momentum Is Dominating the Move -
From our previous analysis, BTC reached the first target at 73500. The price found some buyers again taking BTC up to 75500 but couldn't manage to rise more.
Considering that the price is making lower lows, chances are it will fall further as shown in the chart.
The next target on the list remains 71600 and a major target is set at 70000.
We will reassess the new developments once the price reaches 70K.
You can find more details on the chart.
Thank you! 🍀
⚠️PS: Do your own analysis and use your own strategy to join the trade.
#BTCUSDT @TradingView #crypto #cryptoanalysis #cryptotrading
tradingview.com/chart/BTCUSD…

🟢ANALYSTS' RECOMMENDATION
🔴 Boyd Group Services Inc: National Bank of Canada cuts target price to C$175 from C$270, citing weaker-than-expected third quarter revenue, alongside lower forecasts and a reduced valuation multiple.
1
1
881
🔴 CCL Industries Inc: National Bank of Canada raises target price to C$119 from C$115, stating stronger-than-expected third quarter results, resilient organic growth across all segments, and increased share buybacks and lower capital spending.
1
254
📣#US100 - Posted on 09-Nov-2026 📈
🎯Both Targes Reached 🔥😁

#us100 : A Break Above 27,300 Could Trigger the Next Rally
US100 started to accumulate again and looks like a bullish accumulation.
For the bullish movement theprice has to move above the pattern or above 27300 in order to rise further and in a clear way with volume.
As reporte Today by Bloomberg the hedge funds sold on global tech stocks at one of the fastest rates on record last week.
The move has triggered the biggest wave of single-stock net selling in four months, according to the bank's prime brokerage data as of Nov. 6.
I think that after the mess that Hedge Funds created we can see Indices to recover again.
Bullish targets:
27800
28500
You can find more details on the chart.
Thank you! 🍀
⚠️PS: Do your own analysis and use your own strategy to join the trade.
#NAS100 @tradingview #USindices #trading #stocktrading
tradingview.com/chart/NAS100…

6
1,287
#GRAM: Psychological $1 Support Fuels Bullish Momentum
Gram (prev. TON) fell to levels of 0.99 that were not seen before for this coin.
Once the price reached that area and also a strong psychological price of $1, we can see a strong price recovery of almost +25%.
I think these bullish moves are more related to the business where GRAM is used and maybe it is not their goal to have a very cheap coin. Maybe they are more interested in price stability and to keep Gram above $1
I think Gram can grow further, as shown in the chart.
Optimistic targets:
1.35
1.55
1.68
You can find more details on the chart.
Thank you! 🍀
⚠️PS: Do your own analysis and use your own strategy to join the trade.
#GRAMUSDT @TradingView #crypto #cryptotrading #cryptosignals #cryptoanalysis
tradingview.com/chart/GRAMUS…

6
923