

Web3 Marketing | Crypto, NFT & Trading Growth Specialist 📊 Daily Market Analysis & Charts | 📩 DMs Open for PAID Promos & Collabs
Joined June 2025
- Tweets5.3K
- Following17.1K
- Followers22.5K
- Likes15.8K




The long-term macro chart on $TSLA is setting up for its biggest phase yet ⚡️📈
Every major cycle for Tesla has been defined by a game-changing fundamental shift:
▫️ EV Revolution Era → Built the foundation
▫️ Mass Adoption + Robotaxi Era → Delivered massive expansion (+4,023% peak move)
▫️ AI & Robotics Era → The next multi-year macro expansion ⏳
Technically, price action has cleanly bounced off the lower macro channel boundary and the 0.236 Fib support line right inside the green Buy Zone.
Macro trajectory pointing towards $2,000+ 🚀
#TSLA #Tesla #Stocks #Trading #TechnicalAnalysis

Small-cap equities macro blueprint & liquidity roadmap. 📈
The US Small Cap 2000 Index shows high historical accuracy during major cycle shifts. Every major top since 2011 has been preceded by a clear RSI breakdown on the 1-month chart, signaling momentum exhaustion before price corrects back to long-term trendline support.
• Current technical structure indicates another monthly RSI breakdown in progress.
• Historical pullback metrics point toward a potential -27.25% move from peak.
• Major structural support levels rest between 2,250 and 2,400 (0.382 Fib & MA confluence).
Monitoring small-cap liquidity closely as risk-on market direction heavily depends on support holding at these macro levels.
#Russell2000 #Crypto #Macro #Altcoins #StockMarket #Trading

Dotcom Bubble vs. A.I. Supercycle — Micron ($MU) Macro Chart Setup 💥
📍 Current Price Action:
$MU has delivered a massive run out of its multi-year ascending wedge, pushing into parabolic territory.
📍 Historical Comparison:
During the previous cycle, the vertical leg ended in a cool-off back to the 0.382 Fib retracement near the 1M moving averages before finding solid support.
📍 The Outlook:
• Retracement zone: ~$400 (0.382 Fib)
• Long-term expansion target: $1,800+
Macro bullish, but respecting the high-timeframe consolidation phase. 📊
#StockMarket #ChartAnalysis #Semiconductors

$USDJPY bouncing strong right off the bottom of the long-term Channel Up structure 📈
🔹 Buy Zone Reaction: Price respected key channel support and is pushing back up.
🔹 Moving Averages: Holding strong above the 1D MA200 and attempting a clean reclaim of the 1D MA50.
🔹 Upside Target: Next major Fibonacci expansion zone lined up at 164.900 (+7.85% move).
Structure remains bullish as long as the lower trendline holds 🔥
#USDJPY #Forex #TechnicalAnalysis #FX #ChartAnalysis #TradingStrategy

Every single $BTC cycle follows the exact same mechanical script:
🔹 Blue Dot: Local top & initial 1D MA50 crossover
🟧 Orange Dot: Golden retest of the 1D MA200 support
↗️ Black Arrow: Parabolic macro expansion phase
Traders get shaken out during the MA200 retest every single time, right before the biggest move of the entire cycle happens.
Positioned and locked in for the next leg higher in crypto history
$BTC #Crypto #MarketAnalysis

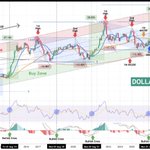
🚨 Macro Alert: The $DXY chart is flashing another major cycle pattern.
Historically, every time the dollar rebounds out of its channel buy zone, crypto and equities face heavy selling pressure.
A push toward the 120+ target signals massive upcoming volatility across crypto markets. Position yourself wisely. 👀📉
#CryptoNews #Bitcoin #MacroEconomy #CryptoCommunity #TradingView

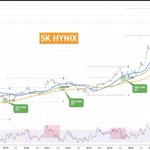
$SKHynix (KRX) Weekly Technical Overview 📊
Looking at the long-term weekly chart, SK Hynix consistently follows a well-defined cyclic structure during major market pullbacks. Every historical macro peak over the past decade has eventually corrected to retest the 0.382 Fibonacci retracement level before building momentum for the next leg higher.
Current Technical Setup:
🎯 Primary Target Zone: ~950,000 KRW (Fib 0.382)
📈 Key Dynamic Support: Confluence with the 1W MA50, 1W MA100, and 1W MA200 moving averages approaching from below.
📉 RSI Indicator: Resetting from heavily overbought territory, mirroring previous mid-cycle cool-offs.
A drop toward the 950,000 KRW level represents a textbook technical reset rather than a trend reversal.
#SKHynix #TechnicalAnalysis #Semiconductors #StockMarket #TradingStrategy

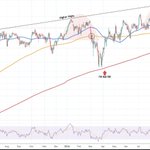
🚨 GERMANY DAX 40 AT CRITICAL SUPPORT! 🇩🇪
The DAX 40 index is reaching a decisive turning point on the daily chart. After repeatedly forming higher highs along the upper resistance line, buyers have lost momentum, dragging the price straight down to test the key 1D MA200 support level.
Key Technical Breakdown:
• Resistance: Upper channel boundary hit at local peaks
• Current Level: Retesting 1D MA200 support around 24,800
• Downside Target: A confirmed break below this moving average projects a sell-off down toward 23,700 EUR or lower toward the 1W MA100 trendline
High volatility expected as the market decides whether to bounce or break down 📊👀
DAXGER40
#DAX40 #Trading #TechnicalAnalysis #StockMarket #FinancialMarkets

History doesn’t repeat, but it sure does rhyme. 📈
$BTC is once again sitting right at the lower green "Buy Zone" on the macro logarithmic channel.
Looking back at every major cycle—2012, 2015, 2019, and 2023—retesting this green band has marked the ultimate long-term accumulation zone right before the next explosive phase.
🔹 Current Level: Sitting in the green Buy Zone at ~$82k
🔹 Macro Projection: Upper red "Profit Taking Zone" targeting $270k+
🔹 Cycle Alignment: Sine wave indicators aligning with the classic 4-year cycle rhythm
Multi-year market structures don't lie. The macro trend is loading up for the big move. 🚀
#Bitcoin #BTC #Crypto #TechnicalAnalysis #CryptoMarket

$AVGO Chart Analysis & Projections 🎯
The current daily chart structure shows a clear pattern breakdown that mirrors previous price action:
1️⃣ Price Action: Higher Highs in price, but failing to maintain bullish momentum.
2️⃣ Indicator Divergence: RSI printing Lower Highs, signalling weakening buying pressure.
3️⃣ Trendlines & MAs: Rejection at the 1D MA50/MA200 dynamic resistance cluster.
4️⃣ Target Zone: Path of least resistance points directly to $312.50, resting on strong horizontal support and the 1W MA100.
Keep this key level on your radar for the coming sessions! 🚨
#AVGO #StockMarket #Trading #Charts #DayTrading #Investing

Dow Jones Technical Update
$US30
Price action continues to strictly respect a descending channel structure on the daily chart.
Key Highlights:
• Resistance: Heavy selling pressure confirmed after rejections at the 4H MA50 & MA100 inside the Sell Zone.
• Downside Target: Price is heading toward the 49,800 confluence zone, where the channel bottom meets the 1D MA200 and Fib extension support.
Bears remain in full control while price stays below dynamic resistance 📍
#DowJones #TechnicalAnalysis #StockMarket #Trading #US30


History looking ready to repeat itself on $RKLB 📉
• Weekly Head & Shoulders pattern fully formed
• 293-day fractal comparison hinting at a major correction
• Key breakdown target sitting near $36.50 / 1W MA200 zone
Keep an eye on those weekly moving averages 📊
#Stocks #TechnicalAnalysis #RKLB

$USOIL continues to trade cleanly within the established ascending channel, printing consistent higher highs and higher lows. 📈
After a healthy pullback and bounce off key support levels, the market structure remains strongly intact. Eyes on the upside targets as buyers step back in to defend the trendline. 🔥
#CrudeOil #TechnicalAnalysis #ForexTrading #Commodities #TradingView

$EURUSD bear cycles continue to act as a major macro signal for equities 🚨
Every single shaded red region on this chart marks a $EURUSD bear cycle, and each time,$SPX inevitably pulls back to test key moving averages—specifically the 1W MA100.
With the next EURUSD downtrend underway, the setup points toward an upcomingSPX correction down to the 1W MA100 line.
#SP500 #Forex #Investing #StockMarket

The 1-Month chart reveals one of the most reliable technical patterns in $BTC history: the ~1,430-day macro cycle.
Every cycle follows the exact same playbook:
📍 Cycle Top: Local peak forms around the 1,430-day mark
📍 1M MA50 Test: Bear market bottoming phase directly on the 50-month moving average
📍 1M MA50 Retest: Technical confirmation marking the official launchpad for the next leg up
We have officially completed the 1M MA50 retest.
The cycle structure remains fully intact, with the macro projection pointing toward a $150,000 Cycle Top.
Patience is rewarded in macro trades. 📈
#Bitcoin #BTC #Crypto #TechnicalAnalysis #Macro

EUR/USD multi-year descending channel analysis 📐
• Resistance Cluster: Textbook rejection off the top Sell Zone, aligning with key weekly and monthly moving averages (1M MA200).
• Indicator Signal: RSI printing a strong Bearish Divergence on the higher timeframe, signaling waning bullish momentum.
• Downside Target: Primary path suggests a leg down toward the high-frequency Buy Zone near key Fibonacci retracement levels (~0.5 - 0.618 Fib).
• Structure: Higher-timeframe market structure remains heavily slanted in favor of the bears until a structural breakout occurs.
$EURUSD #ForexTrading #TradingView #Charts #Currency


If you trade #crypto, you CANNOT ignore #US100 right now 📊
Weekly chart is showing a textbook Megaphone top in the upper resistance band. A full retracement opens up a pullback toward 26,250 before the real buying zone activates.
Respect the macro trend, protect your capital! 🛡️
#BTC #Trading #TechnicalAnalysis #Markets #CryptoNews
