

Trader utilizing @SkylitAI // Mastering mind + body // Health as a performance edge → HakYourHealth 🧘🏻 // NFA
Joined April 2020
- Tweets541
- Following237
- Followers1.3K
- Likes692

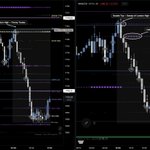





Didn’t play to my standard at my pickleball tournament yesterday. I can call that a failure or a rep. I’m choosing rep
Reading The Power of Now made me realize I’ve spent a lot of my life stuck in my head, always replaying the past or worrying about the future. The only place I can act is the next point, or the next trade. That’s the present moment, and it’s what I try to get back to after a loss
Nick Saban’s idea has stuck with me: don’t think about the national championship. Think about what you need to do on this play, in this moment. Practice the daily process of becoming the best version of yourself, and the opportunity to win comes from that
When I felt myself starting to unravel, I caught it, reset, and said my mantra: all I do is execute one shot, one point at a time. In trading, it’s the plan, one trade at a time
A high standard and being kind to myself can live together. Negative self talk doesn’t raise the standard. It just makes the next trade harder to take. I treat myself the way I’d want to coach someone else: honest about what went wrong, and still on my side
You’re always practicing something. When I make a mistake and rip into myself, I’m practicing that. When I catch it and and go back to the process, I’m practicing that. Neither feels like practice, and both get easier the more I repeat them. Be intentional with the reps
A conversation at lunch today reminded me what changed things for me.
She asked what she could do for her anxiety. My answer was less complicated than she expected: bring awareness back into your body, starting with your breath.
Same advice works in the markets. Can you come down after a loss? Can you sit still when nothing is setting up?
That's the skill. Breathing deeply into the ribs, awareness in the present moment, slow movement when the stress spikes.
Nervous system hygiene. Skip it and the market finds the cheapest version of you.
I was wrong about my bias last night, and I didn’t flip it
I got my win off the Asia open, but then we lost the $QQQ 720 floor and trended down through Asia and into London. My entry model gave me great short setups towards the second half of Asia, but I stayed bullish and didn’t take them
London ended with support, and NY pumped into this: two double tops off the $SPX 7700 King node and $QQQ 715, a sweep of the London highs, Timmy Trades firing, and a ceiling roll down on $QQQ 714. This $QQQ roll down came from using the expiration setting into Friday
At the NY open, after such a big gap down, I felt more downside wasn’t probable. But the setup didn’t care what I felt. Very clean move that I paperhanded 🤣
Lesson: I only built the bullish case. When the $QQQ 720 floor broke, I had no plan for the other side, so I missed the flip. If I’d written the bearish case too, with the 715 and 710 nodes for Friday as the targets, I’d have seen the short coming. Build both cases before the session. Being wrong isn’t the problem. Staying wrong is 🤝🏽


Another session open this week where a fresh extreme FVG held as support 😮
The setup: MACD divergence into the Asia open, a fresh extreme FVG as support, and a session open gap above
The heatmap read:
- $SPX: 7720 gatekeeper with an air pocket up to Pika Kings
- $SPY: a messier map, but at the bottom of its range. SPY 769 is the weekly King node and SPY 770 was the King node for tomorrow. This made me view it as stacked support nodes
- $QQQ: 720 at the bottom of the range, with a range all the way up to a triple Pika stack at 731-733
- $NDXP: also had a King upside
I trimmed 60pts and moved the rest to breakeven as runners after the trim. They took me out of this one, but I am curious to see how things play out with how the maps look. Still leaning bullish, but where will price find support 🤔

Both New York opens this week dumped on bullish days. Where this morning’s dump ended was on the @SkylitAI map before the open 🗺
The idea Kwon explained to me, which I shared in my last thread, showed up again today: the market moves behind the scenes over the weekend, so when the new week opens, each session tends to grab the liquidity left behind
This week:
- A bullish Sunday open with a big gap up left liquidity behind
- Monday’s NY open dumped into the previous Asia session’s extreme FVG
- Today’s NY open dumped again, deeper this time, into the extreme FVG from the start of the impulse at the Sunday open, and reversed
The heatmap showed today’s $QQQ expiration was all upside nodes, with the three derivatives of NASDAQ having King nodes pointing up:
- $NDX 29675 King has been upside all week and remained there even after getting tagged on Monday
- $QQQ 725 has been visible since yesterday’s open, and it’s also the King for Friday 10/30
- $NDXP 29510 King popped in for today’s expiration as a solo node 15 minutes into the NY open
At the bottom of the range, the $QQQ 710 node for Friday 10/23 sat right where the untouched liquidity was resting, under the Sunday open extreme FVG. If 710 held, this had a clear range above, that's the setup. Once resting liquidity gets grabbed, that’s often where the bigger moves begin
Looking back, this is what a weekly heat map thesis looks like: built from every expiration through Friday, not only today’s. Today’s map showed the direction, and the further expirations showed where the flush would end
What happens at the Sunday open can set the weekly map: where liquidity sits, and which nodes line up with it
As I continue refining my read on liquidity, this is a good example of a pattern that may show up again


Took a loss and a breakeven that ran 200 points today, and I feel great about it 😆
The first loss was a controlled loss that followed my system. But today I was a Timmy. My stop was the entry for the low of day
I post a lot of winners. Time to post more of the losers, because how you use your losses as lessons is how you improve ✍🏽
And check out this chart, that stop hunt dipped into the previous Asia session’s extreme FVG, untouched until that tick. It ripped about 300 points from there
The other lesson was my breakeven trade. Clean entry, very little drawdown. As soon as it started working, I moved my stop to breakeven. I hadn’t trimmed and hadn’t hit my first target, so my plan gave me no reason to
I just saw it work and decided to protect a position that didn’t need protecting, maybe because I’d just taken a loss. It tagged me out, and then it ran 200 points
The rule I’m taking from it: I move my stop when the plan says to, after a trim or my first target. Not when I feel nervous

A heatmap is only as useful as how fast it shows you the dealer’s repositioning. The King nodes flipped, and I saw it within a minute. That minute was the entry
The heatmap read:
- $SPX: price came down into the bottom of the positive gamma stack, and 7735 flipped to King, showing a range up to 7760
- $SPY: exposure built at 771 as a gatekeeper below, bouncing price up toward the 772 negative gamma King above
- $QQQ: price overshot the 721 King and ran into the $NDXP King Node, which acted as a gatekeeper for the whole 723 to 717 range, allowing the bounce. The $QQQ map still had a lot more downside
- @SkylitAI Timmy Trades fired the moment price touched the NDXP King Node
We hit the top of the range on QQQ and SPY. SPX never reached 7760, because the King kept moving up with price and settled at 7750.
Once price hit that SPX 7750 King, it switched to the downside at 7725. I didn’t take the short, but the signs were already on the map (circled on Atlas), and price plummeted from there 🩸


Asia session recap ✍🏽
I wasn’t available for the Asia open, so I didn't catch the first long entry off the floors
The bullish thesis still held on the map. Price opened Asia coming down into the $SPX 7725 and $QQQ 723 floors, with a clear range above
So I looked for a second entry on an iFVG setup off market structure. It never filled, and that’s okay. You won’t catch every trade, and even when the plan plays out, you won’t always get your entry
Then my take profit, the NY PM High, turned into a short. The heatmap read:
- $SPX was capped out and overshooting its 7750 negative gamma King Node
- $SPY was above its 772 negative gamma King Node and deflecting off 773, but it did show a range up to 775
- $QQQ 730 positive gamma King Node overhead, with an air pocket back down if it deflects and plenty of nodes below
- $NDXP 30000 Node in alignment with $QQQ 730
- The risk: big negative gamma nodes stacked above $QQQ 730 (732 and 734) meant a squeeze could be possible
@SkylitAI showed Timmy Trades fired for both $ES and $NQ on the sweep. About 3 points of drawdown, and I took it for a quick 50 points before bed
A level you’re targeting can also be a level where price reacts. I stayed flexible and took what the market gave me 🤝🏽


Example of trading the data candles with the @SkylitAI heatmaps. The data lows got taken, and price reacted right off $QQQ 717
On the 0DTE map, that node is a lower exposure negative gamma node. It’s Friday’s expiration ($51.4M), sitting right under today’s QQQ 718 Pika ($21.4M). That made it a double positive gamma support, which I’d have missed reading Trinity alone
New part of my process: I check the nearby expirations to see where the exposure sits. If most of it is in today’s expiration, Trinity is enough. If there are major nodes in the next few expirations, I keep an eye on them too 👁

Got this DM on a day I didn’t follow my own system. Insane timing and well needed for me 😆
It’s also a reminder of why I share what I share. I review my own trades first, and if what I learn on this journey helps someone else, I want to put it out there. It’s not an easy road, and having people to learn alongside makes a big difference.
Last night in @SkylitAI stages I said, "You’re not always going to apply everything you know in real time. We have the knowledge. But we have to keep reminding ourselves."
That comes down to repetition and consistency in your process. Today proved it. It was a trend day down, I've reviewed these days before, I know how to handle those... but once I missed the initial short, I kept trying to buy the dip.
My takeaway from reviewing today: I’m basically freestyling and relying on my memory instead of a written checklist. If it isn’t written down and read every day, I can’t expect to execute it on autopilot in the moment.
The first task is to identify the regime before the first trade: trend or whipsaw?
- On the heatmaps: a whipsaw looks like a range, with big nodes on both sides of price. A trend shows new nodes stacking in the direction of the move while the nodes behind price fade, often with ceilings rolling down or floors rolling up
- On the charts: Are we inside the previous session or previous day’s range, or outside it? Outside day = sign of a potential trend
- On a trend day: follow the trend off the ceiling roll downs (or floor roll ups on an up day) or scalp your deflections. If you trade counter trend, be diligent with taking profits
- Second tests of nodes tend not to hold on a trend day, they break structure and make a new low. The better counter trend entries tend to come after that break of structure when the overshoot finds the next node and deflects
The game is simple. We’re the complicated part. Here’s what I’m practicing:
1. Treat losses as lessons. A loss is a data point, not a definition of who you are
2. Review without judging. It isn’t good or bad, it just is
3. Be strict with the process, hard on your standards, and kind with yourself
I’ll write more on the mental side in my next article ✍🏽

Took this one in Asia off the @SkylitAI overnight heat maps. Zero drawdown, right off the $SPX 7800 node
I traded $ES this time. $NQ was overshooting its $QQQ 743 node (lots of Timmy Trades on the overshoot = lots of liquidity = lots of fuel) just as $ES came down into $SPX 7800
The heatmap read:
- $SPX: 7800 was the highest exposure node on the October monthly expiration ($26.3M) and double stacked with the $SPXW map. $SPXW showed a range from 7800 to 7820, and the monthly showed a clear range up to 7850 above it
- $SPY: alignment at 777 with a mini reverse rug from 777 to 779/780
- $QQQ: 743 as a potential floor, with an upside King Node (750, -$20.6M) and an air pocket range above
- $NDXP: also pointing upside with a King Node
If those levels held, bullish for the night. Long ES with a 2 point stop. Node to node for 10RR ✅

This beautiful LOD trade was guided live on @SkylitAI stages by @garma_don_, @Simply0DTE, and @nicog8_trading
The maps and the charts all lined up at the same spot 🎯
$ES was the weaker index and swept the Asia low at the low of day. At that same moment:
- $SPXW 7785 King Node, the gatekeeper of the SPX range, lined up with ES’s low. The 7760 node below was the downside risk
- $SPY hit 776, the bottom of its range, King Node
- $QQQ reached 740 at the bottom of its range, with a reverse rug up
- $NQ tagged the 0.786 fib on the IB30 range, right on the QQQ 740 Pika floor
- Timmy Trades fired on the $ES sweep and the $NQ retracement
Trinity 3/3 with TA alignment. The path up looked iffier: SPX 7800 (major positive gamma) sat overhead. NDXP's map was very messy, showing a rainbow road
It was so messy that I had to toggle it off to clean up the charts lol. But as a deflection point for entry, it was super clean, S+ tier setup ⭐


Breakdown of this morning's pump
My stop last night sat right at the Asia low, the most obvious liquidity pool on the chart and it got swept.But the level my stop sat on was also where the long re-entry was.
Here’s why I stayed confident in the long thesis after the stop:
- The Asia low got swept, so that liquidity was taken
- The NDXP floor node slid and got reclaimed fast
- The QQQ 740 floor ($76.1M) reclaimed
- A Timmy Trade fired right at the sweep
- Upside King Nodes still above (QQQ 745, -$81.6M)


Woke up to the stop. The long peaked at +130 points and never hit my No Wick target. Price gave it back, then swept the Asia low.
Current read: after the sweep, price is back above QQQ 740 ($76.1M). The map still leans bullish above 740, and it’s bouncing hard off the sweep. Plus the slide of the NDXP floor node
Longing $NQ into the overnight. The Asia low lined up with multiple signals:
Stats: the low hit max STDV expansion from @TheQuietCalf + high percentage overnight probabilities to the upside
Momentum: MACD divergence into the low, then a MACD flip
Heatmaps:
- $SPXW at its 7795 King Node floor with a range to 7815, plus the SPX monthly King Node at 7800 and more exposure above
- $SPY bounced off 776, with an upside King Node at 779
- $QQQ 740 Pika floor, a negative gamma air pocket above it, and three upside Barney nodes between 745-747
- $NDXP near a floor, with most of its exposure upside for the coming days
ES overshot the SPX King Node, so SPX alone wasn’t clean. But ES trades off SPX and SPY together. SPY’s lower range ran 775 to 776, and price bounced off 776 (52% of the King Node). That level acted as the gatekeeper and deflection point, and it lined up around the QQQ 740 floor.
Targeting the No Wick at the Asia High. Still open, let’s see if I wake up to this hitting 😆
