

Finding hidden gems/stocks that are quality, competitive edge, undervalue would be a bonus; for my ownself, sharing my journey. Not investment advice
US Stocks mainly
Joined February 2009
- Tweets2.4K
- Following460
- Followers1.2K
- Likes211







Pinned Tweet
Nowhere close to you both, but was an early investor in $PLTR back in 2022 / 23 when nonone cared.
Invested in HBM ( $MU, $DRAM)
Invested in photonics ($AIXA, $TSEM, $VECO, $LITE, $COHR, $CRDO)
Invested in other semis too ($SANM, $KLIC)
Very old investor in some of mag7 including Apple, $GOOGL, $AMZN
Invested in minerals mines (Gold, Copper), now thinking of tungsten
4
9
2,458
🐊 A Bit of Optimism on a Gloomy Day
US forward margins have reached 16.9%, but Europe and the rest of the world are improving too.
BlackRock raises an interesting possibility: could some of the extraordinary improvement in global profit margins be an early sign of AI productivity gains?
Perhaps AI’s benefits aren’t only showing up in chipmakers and data centres. They may be quietly appearing in lower operating costs, better efficiency and higher margins at companies that don’t even identify AI as the reason.
It’s an optimistic hypothesis, not yet proven. But perhaps we’re looking for AI’s returns in the wrong places.
Whether it is AI or AI is just part of it, the margins tell a positive story, its not all doom and gloom, its finding the right things.

1
4
195
🐊 Don’t read Anthropic’s $ANT debut as a sentiment gauge. Read it as a capex event.
Anthropic raised $81.3B through its IPO, including founder share sales, alongside a $26B private placement. That’s a $107.3B deal.
But the more important number is buried in its prospectus: approximately $900B in total compute commitments, with $70.7B due over the 12 months following September 2026.
Where does that spending ultimately go? Accelerators, HBM, networking, optics, data centres and power.
The market tape told a different story today. ANT opened at $111.50 against its $83 IPO price, before retreating towards $97. Investors were selling risk. But the underlying demand for compute hasn’t disappeared.
My takeaway: Don’t confuse a weak market reaction with a weakening infrastructure demand cycle. The capital and compute commitments are still there. The question is which suppliers actually capture the economics.

3
236
🐊 𝗪𝗵𝘆 𝗜’𝗺 𝗡𝗼𝘁 𝗖𝗵𝗮𝘀𝗶𝗻𝗴 𝘁𝗵𝗲 𝗔𝗻𝘁𝗵𝗿𝗼𝗽𝗶𝗰 𝗜𝗣𝗢
Anthropic could become one of the biggest winners of the AI revolution. But an excellent business doesn’t automatically make an excellent investment.
At $83, the IPO implies ~$1.5T fully diluted. Revenue growth is extraordinary, but profitability hasn’t settled. Q2’s $974M operating profit flipped to a $567M loss in Q3, partly due to expensive short-term compute and non-cash charges. Even on an adjusted basis, margin slipped from 19% to 15%. Compute took ~58% of Q3 revenue, and Anthropic has disclosed ~$901B in compute and infrastructure commitments.
Then there’s supply. Up to 316M shares could become eligible for sale from day one, rising to ~1.6B by early February. That’s nearly twice the 825M shares sold in the IPO.
I would rather wait than chase the opening-day excitement.
What would make me buy? $55–60, implying ~$1.0–1.1T fully diluted, close to the May private round’s $965B headline valuation. That’s provided margins stabilise and growth turns into genuine free cash flow.
Right now, a large share of each revenue dollar flows straight to the compute layer. Until more of it stays with Anthropic, I’d rather own selected suppliers.
I’d rather miss the rally than buy a great story without a margin of safety.
Not financial advice.
4
206
🐊 𝗡𝗩𝗜𝗗𝗜𝗔'𝘀 𝗯𝗲𝗮𝘁 𝗴𝗮𝘃𝗲 𝗦𝗲𝗼𝘂𝗹 𝗮 𝗹𝗶𝗳𝘁. 𝗜𝘁 𝗱𝗶𝗱𝗻'𝘁 𝗹𝗮𝘀𝘁.
KOSPI opened higher on Thursday, then slipped under 5,000 with SK Hynix and Samsung both lower. AI-capex doubts get the blame, but TrendForce's PC data is the bigger tell.
▪️ Notebook shipments fell 15.8% QoQ in 3Q26, and OEM DRAM inventory weeks have risen since.
▪️ 4Q26 PC DRAM contracts are forecast up 13–18%, slower than last quarter. Client SSD is up less than 5%.
▪️ Suppliers are tentatively planning PC DRAM supply cuts for 2027.
This cycle now depends on where the bits go, not how many get made. For Micron, Hynix and Samsung, 2027 comes down to two things: whether server and HBM absorb what PC gives back, and whether capacity can shift fast enough to protect margins.
(I own MU.)
2
175
🐊 Before a tsunami hits, the sea often pulls back before returning with devastating force. I wonder if that is what we are seeing in the market with NVIDIA. Investors have already pulled money out, and the share price has receded in anticipation of the results. But if NVIDIA delivers a weaker-than-expected forecast, particularly if the CFO-turned-CEO takes a more cautious stance on areas such as Singapore sales, the real wave of selling could still be ahead. Today’s market jitters may just be the water pulling back before the tsunami.
1
3
221
The Market Has Fallen Out of Love With Photonics. But Has It doesnt mean Supply Chain Bottlenecks have Resolved? And AI Development would slow down
🐊 The market has fallen out of love with photonics. I understand that. Some of these stocks are getting absolutely hammered. I also understand why investors are questioning AI valuations and spending.
But here is something worth remembering: markets can change their mood overnight. Factories, production schedules and technological innovation don’t work that way.
AI infrastructure is still being built. The demand for faster connections, more computing power and larger semiconductor packages hasn’t simply disappeared because investors have become nervous.
And while everyone debates whether photonics stocks have further to fall, I think there is another bottleneck worth watching.
The forgotten bottleneck: T-glass.
Some Investors who are still in the game are watching the AI substrate squeeze as an ABF capacity problem. But I think they may be overlooking a bottleneck further upstream.
Inside advanced package substrates sits specialist low-CTE T-glass cloth. It helps prevent large, powerful AI chips from warping under heat.
One Japanese company, Nitto Boseki (3110), controls roughly 90% of this market. ( I have talked about it a few times earlier as well)
On November 5, Nittobo raised its full-year outlook again. Its electronic materials business reported 63.1% year-on-year operating profit growth in the first half.
The supply response is coming, but not immediately.
Its new Fukushima facility is scheduled to start shipping in July 2027. The longer-term expansion plan targets 3.6 times FY2025 capacity by FY2029.
Even with incremental capacity coming online, my concern is that AI demand will grow faster than available supply before the second half of 2027.
There is an interesting detail. In August, Nittobo said it had largely completed its planned T-glass price increases, with no further increases planned at that time.
This is an important distinction: Nittobo may have more allocation power than pricing power. Scarcity doesn’t automatically mean unlimited pricing power.
And don’t confuse additional weaving capacity with new supply. Nanya Plastics is expected to weave some of Nittobo’s cloth. That does not create an independent competitor.
The real test is whether a non-Nittobo glass source can qualify with a tier-one substrate manufacturer such as Ibiden or Unimicron.
My takeaway: I wouldn’t confuse a market sell-off with the disappearance of an industrial bottleneck.
The stocks may be out of favour. The underlying supply-chain constraints deserve a closer look.
And, as always, a good bottleneck doesn’t automatically make its controlling company a good investment at any price.
7
436
🐊 Gold represents >10% of my portfolio, so when Stanley Druckenmiller buys gold miners, I pay attention.
Duquesne’s Q3 13F shows three new positions:
▪️ Newmont (NEM): $43.9M
▪️ Barrick (B): $42.9M
▪️ Agnico Eagle (AEM): $42.3M
What caught my attention is how similar the allocations are. My guess is that this is less about picking individual mining winners and more about gaining exposure to gold itself.
But let’s keep things in perspective. Together, these positions represent roughly 2.9% of his reported $4.47B 13F portfolio. This isn’t an all-in bet.
Gold has also fallen around 31% from its January record of $5,598. Rising Treasury yields, a stronger dollar and changing Fed expectations have all contributed.
I was also trying to find some of his public statements about gold to understand his motivation and turns out that
▪️ In February, Druckenmiller described gold primarily as a geopolitical trade.
▪️ In August, he warned about the risks building in the bond market.
▪️ On November 17, he spoke about capital preservation and limited equity exposure.
My interpretation is that gold could be serving as portfolio insurance in an increasingly uncertain environment. That’s just my guess, not something his 13F proves.
🐊 I remain bullish on gold. Druckenmiller’s move reinforces my interest, but it doesn’t make my thesis right.
One final caveat: his 13F reflects positions held at a point in time in past not necessarily what he owns today.

5
451
Tech now trades below the S&P 500 on forward P/E for the first time since 2017.
I don't think that makes it a buy-the-dip moment. The market is pricing the AI suppliers like the leveraged data-centre builders.
$NVDA $LITE $CRWV $NBIS $APLD: what's broken, what's cheap and what's worth owning
In my free post I cover this one
stockcrock.substack.com/p/th…
3
288
🐊 Nebius $NBIS : Down 64% from its peak to $107. Buy, hold or walk away?
~$107 vs a 52-week high of $299.86 lets say $300, thats almost 2/3rds drop.
I posted about this weekend and said that Demand isn’t the problem. Delivery is. And I refrained from a price target, as I could see it as a falling knife.
So 2026 revenue was cut to the low end, Microsoft capacity slipped into 2027, and capex jumped to $27B, with $40–45B planned for 2027. The contracts are still in place: demand deferred is not demand destroyed. But every quarter of delay costs money in financing and returns.
The numbers behind it:
Q3 operating cash flow was –$273M despite $3.4B of prepayments.
And $325M of Q3’s $981M revenue was one-off.
Plus to be fair Nvidia’s leadership shock hit the whole AI trade, but hold on, Nebius has its own execution problem.
My call: HOLD, but no blind averaging down. Proof I want: Microsoft capacity live on schedule, positive operating cash flow, $12–13B revenue in 2027, and pre-tax breakeven in Q4 2027.
I own NBIS. Not financial advice.
Full inspection of Nebius, Nvidia, CoreWeave, APLD and LITE in my latest post stockcrock.substack.com/p/th…
1
5
467
Everyone is watching Nvidia's print. The bigger structural change landed today.
BIS's new interim final rule brings remote compute into export controls. Overseas data centres must now do due diligence on their customers. Those supplying significant volumes of compute to firms headquartered in China, Russia or Iran face restrictions. Chip exports to companies headquartered in Singapore, Malaysia, Indonesia, Thailand and Brazil now need a licence. The provision takes effect in 90 days.
The Southeast Asian neocloud route has been a quiet release valve for GPU demand. The constraint is no longer only shipping the chip. Now it's proving who rents it.
(I own NVDA.)
3
205
Most investors still treat hybrid bonding as an HBM story, with BESI as the main winner.
The timing looks wrong. At Hot Chips in August, SK hynix said it does not expect hybrid bonding to be ready for HBM4E. JEDEC has already raised the HBM height limit to 775µm and is discussing up to 900µm, which leaves room to keep stacking with microbumps.
That keeps the TCB and MR-MUF tools from Hanmi and ASMPT in use for at least one more HBM generation.
BESI's hybrid orders have more than doubled this year, but its October call pointed to a US logic customer moving into volume production and new co-packaged optics orders.
The signal to watch is BESI's order mix. If 2027 orders keep coming from logic and CPO rather than memory, its HBM upside is an HBM5 story around 2029, not a 2027 one.
2
4
440
🐊 𝗡𝗲𝗯𝗶𝘂𝘀 𝗮𝗳𝘁𝗲𝗿 𝗲𝗮𝗿𝗻𝗶𝗻𝗴𝘀: 𝗪𝗵𝗮𝘁 𝗱𝗶𝗱 𝗺𝘆 𝟱 𝗶𝗻𝘃𝗲𝘀𝘁𝗼𝗿 𝗾𝘂𝗲𝘀𝘁𝗶𝗼𝗻𝘀 𝗿𝗲𝘃𝗲𝗮𝗹?
Yesterday, I posted five things I wanted to investigate as a Nebius shareholder. Not simply whether it would beat estimates, but whether AI infrastructure demand was translating into sustainable shareholder returns.
The summary: Q3 revenue beat estimates by 8% at $981M, and adjusted EBITDA reached $466M. But 2026 revenue is now expected at the low end of $3–3.4B, capex rises to $27B, and 2027 capex is projected at $40–45B.
Here’s what I found.
𝟭. 𝗥𝗲𝘃𝗲𝗻𝘂𝗲: 𝗧𝗵𝗲 𝗯𝗲𝗮𝘁 𝗻𝗲𝗲𝗱𝘀 𝗰𝗼𝗻𝘁𝗲𝘅𝘁.
$325M of Q3 revenue was non-recurring asset-light deployment revenue. Excluding this, revenue was approximately $656M, up 12.6% QoQ, not 68%.
At $3B FY revenue, Q4 must deliver approximately $1.04B. That’s roughly 58% above the underlying Q3 base. The beat is real, but so is the execution hurdle.
𝟮. 𝗠𝗶𝗰𝗿𝗼𝘀𝗼𝗳𝘁: 𝗧𝗵𝗲 𝗰𝗼𝗻𝘁𝗿𝗮𝗰𝘁𝘀 𝗿𝗲𝗺𝗮𝗶𝗻, 𝘁𝗵𝗲 𝘁𝗶𝗺𝗲𝗹𝗶𝗻𝗲𝘀 𝗱𝗼𝗻’𝘁.
Some third-party capacity is delayed into H1 2027. At the New Jersey (Vineland) site, operator DataOne began retiring temporary generation late in Q3, which reset the schedule.
More than half of the Microsoft capacity is still expected by year-end, with the remainder in Q2 2027. They gave a date; now they need to hit it.
𝟯. 𝗣𝗼𝘄𝗲𝗿: 𝗧𝗵𝗲 𝗴𝗮𝗽 𝗶𝘀 𝘀𝘁𝗶𝗹𝗹 𝘁𝗵𝗲𝗿𝗲.
Over 4GW contracted, targeting 5GW by year-end. But no updated connected-power figure was provided.
Contracted power is an option on future revenue, not revenue itself. The market needs evidence of conversion into operational capacity.
𝟰. 𝗖𝗮𝗽𝗲𝘅: 𝗖𝘂𝘀𝘁𝗼𝗺𝗲𝗿 𝗳𝘂𝗻𝗱𝗶𝗻𝗴 𝗵𝗲𝗹𝗽𝘀, 𝗯𝘂𝘁 𝗱𝗼𝗲𝘀𝗻’𝘁 𝗲𝗹𝗶𝗺𝗶𝗻𝗮𝘁𝗲 𝗿𝗶𝘀𝗸.
Prepayments now cover over 100% of capex on Q3 contract wins. Management expects prepayments and asset-backed financing to cover 75–85% of 2027 capex.
Encouraging, but Q3 capex was $7.3B against negative $273M operating cash flow.
Nine-month funding included $10.1B convertible issuance and $3.9B treasury-share proceeds. Shares outstanding rose approximately 16% YoY.
Growth is being funded, but existing shareholders are paying part of the bill.
𝟱. 𝗨𝗻𝗶𝘁 𝗲𝗰𝗼𝗻𝗼𝗺𝗶𝗰𝘀: 𝗧𝗵𝗲 𝗻𝘂𝗺𝗯𝗲𝗿 𝗻𝗲𝗲𝗱𝘀 𝗱𝗲𝗰𝗼𝗱𝗶𝗻𝗴.
AI Cloud EBITDA margin reached 53.2%. Management’s 19-month payback sounds attractive, but this is revenue payback on comparable deals, not profit payback.
On my rough maths, applying the 53.2% margin implies roughly 36 months of EBITDA payback, before financing and other costs. This assumes new capacity achieves the same margin.
Pre-tax break-even is only expected in Q4 2027, assuming five-year GPU depreciation. Hardware replacement cycles and actual economic life matter. Accounting break-even isn’t necessarily economic break-even.
🐊 𝗧𝗛𝗘 𝗢𝗩𝗘𝗥𝗟𝗢𝗢𝗞𝗘𝗗 𝗪𝗔𝗥𝗡𝗜𝗡𝗚𝗦
▪️ RPO rose just 3%, from $37.5B to $38.7B, despite nearly $1B of revenue recognised. On a simplified basis, that implies roughly $2.2B or less of gross additions to RPO. Modest against $27B of planned annual capex.
▪️ The $7B+ ARR milestone moved from December to February. Management is also moving away from ARR as its preferred measure, focusing instead on revenue and pre-tax earnings. The timing deserves scrutiny.
🐊 𝗪𝗔𝗦 𝗧𝗛𝗘 𝗦𝗘𝗟𝗟-𝗢𝗙𝗙 𝗝𝗨𝗦𝗧𝗜𝗙𝗜𝗘𝗗?
The biggest shock wasn’t revenue; it was the capital requirement. 2027 capex of $40–45B versus expectations around $29B changes the financing and execution equation.
Part of the decline also reversed the previous day’s rally. But the underlying concerns are real.
The market is repricing the cost, timing and risk of growth, not necessarily the demand.
𝗠𝘆 𝘃𝗲𝗿𝗱𝗶𝗰𝘁: The AI infrastructure thesis remains intact. But demand alone doesn’t make this a good investment. Nebius must prove that every additional dollar invested produces attractive incremental returns.
Thats the real test. Not financial advice.

1
4
274
🐊 𝗡𝗲𝗯𝗶𝘂𝘀 𝗲𝗮𝗿𝗻𝗶𝗻𝗴𝘀: 𝟱 𝘁𝗵𝗶𝗻𝗴𝘀 𝗜’𝗺 𝘄𝗮𝘁𝗰𝗵𝗶𝗻𝗴 𝗮𝘀 𝗮 𝘀𝗵𝗮𝗿𝗲𝗵𝗼𝗹𝗱𝗲r - rather than just ‘beat the estimates’
Nebius reports Q3 earnings today. I’m a shareholder, so naturally I want to see the company execute. But I don’t want to confuse a good AI story with a good investment.
The AI infrastructure opportunity is enormous. The question is whether Nebius can turn that opportunity into sustainable shareholder returns.
Here are the 5 things I’ll be investigating:
𝟭. 𝗥𝗲𝘃𝗲𝗻𝘂𝗲: 𝗜𝘀 𝘁𝗵𝗲 𝗮𝗰𝗰𝗲𝗹𝗲𝗿𝗮𝘁𝗶𝗼𝗻 𝗿𝗲𝗮𝗹?
Consensus is around $917M, against $582.3M in Q2. That’s approximately 57% sequential growth. That’s a demanding hurdle.
But even if they beat revenue ( dont wanna sound too hard) I want to understand how much growth comes from newly deployed capacity versus existing operations. Is the Street getting ahead of the deployment schedule, or is Nebius genuinely accelerating?
𝟮. 𝗠𝗶𝗰𝗿𝗼𝘀𝗼𝗳𝘁: 𝗔𝗿𝗲 𝘁𝗵𝗲 𝗰𝗼𝗺𝗺𝗶𝘁𝗺𝗲𝗻𝘁𝘀 𝘁𝗿𝗮𝗻𝘀𝗹𝗮𝘁𝗶𝗻𝗴 𝗶𝗻𝘁𝗼 𝗲𝘅𝗲𝗰𝘂𝘁𝗶𝗼𝗻?
The $17.4B five-year agreement, potentially rising to $19.4B, is impressive. But contracts don’t generate revenue until infrastructure is delivered.
The Vineland facility is particularly important. I want clarity on power availability, construction, commissioning and delivery schedules. Are these commitments progressing as expected, or are deployment timelines becoming a bottleneck?
𝟯. 𝗣𝗼𝘄𝗲𝗿: 𝗧𝗵𝗲 𝗱𝗶𝗳𝗳𝗲𝗿𝗲𝗻𝗰𝗲 𝗯𝗲𝘁𝘄𝗲𝗲𝗻 𝗽𝗼𝘁𝗲𝗻𝘁𝗶𝗮𝗹 𝗮𝗻𝗱 𝗺𝗼𝗻𝗲𝘁𝗶𝘀𝗮𝘁𝗶𝗼𝗻.
This is probably my biggest operational question.
Nebius has a 5GW contracted-power ambition, but its year-end connected-power target remains 800MW–1GW.
These are two very different things. Contracted power represents potential capacity. Connected power gets the business closer to generating revenue.
How quickly can Nebius close that gap? Is this simply the normal infrastructure buildout cycle, or is monetisation falling behind the headline growth story?
𝟰. 𝗖𝗮𝗽𝗲𝘅: 𝗛𝗼𝘄 𝗲𝘅𝗽𝗲𝗻𝘀𝗶𝘃𝗲 𝗶𝘀 𝘁𝗵𝗶𝘀 𝗴𝗿𝗼𝘄𝘁𝗵?
Nebius has guided for $20–25B in FY26 capex, having already spent approximately $8.13B in H1.
That’s an extraordinary investment relative to $3–3.4B in expected annual revenue.
I want to understand how much additional capital is required, how it will be financed, and whether customer commitments and cash generation can support expansion without excessive debt or shareholder dilution.
𝟱. 𝗨𝗻𝗶𝘁 𝗲𝗰𝗼𝗻𝗼𝗺𝗶𝗰𝘀: 𝗔𝗿𝗲 𝗮𝘁𝘁𝗿𝗮𝗰𝘁𝗶𝘃𝗲 𝗺𝗮𝗿𝗴𝗶𝗻𝘀 𝘁𝗿𝗮𝗻𝘀𝗹𝗮𝘁𝗶𝗻𝗴 𝗶𝗻𝘁𝗼 𝗿𝗲𝗮𝗹 𝗿𝗲𝘁𝘂𝗿𝗻𝘀?
Q2 adjusted EBITDA margin was already 40.6%, with AI Cloud at 49.7%.
That’s encouraging, but EBITDA isn’t free cash flow. Depreciation, interest, stock-based compensation and continuous GPU investment cannot be ignored.
Management’s medium-term EBIT margin target of 20–30% is worth examining against today’s EBITDA margins. Can Nebius turn operating scale into genuine returns on invested capital?
🐊 𝗪𝗵𝗮𝘁 𝘄𝗼𝘂𝗹𝗱 𝗺𝗮𝗸𝗲 𝗺𝗲 𝗺𝗼𝗿𝗲 𝗯𝘂𝗹𝗹𝗶𝘀𝗵?
▪️ Revenue acceleration on good quality
▪️ Microsoft deployments progressing on schedule ▪️ Connected power moving towards 800MW–1GW ▪️ Margins holding up as capacity expands
🚩 𝗪𝗵𝗮𝘁 𝘄𝗼𝘂𝗹𝗱 𝗰𝗼𝗻𝗰𝗲𝗿𝗻 𝗺𝗲?
▪️ Contracted power growing much faster than connected capacity
▪️ Deployment delays
▪️ Escalating financing requirements
▪️ EBITDA growth failing to translate into stronger cash economics
🐊 𝗠𝘆 𝗰𝗼𝗻𝗰𝗹𝘂𝘀𝗶𝗼𝗻
I’m invested in Nebius because I believe AI infrastructure demand has a long runway.
But there’s a big difference between building a business that grows rapidly and building one that generates attractive returns on the capital invested.
The question isn’t how much AI infrastructure Nebius can contract. It’s how quickly it can connect, monetise and earn an attractive return on every dollar invested.
That’s what I’m looking for.
not financial advice.

3
213
The Anthropic IPO: 5 Questions the Price Has to Answer $ANT
Anthropic’s $70–78 IPO range implies up to $1.4T “fully diluted”. October run-rate revenue hit $81B; strategic partners are investing $26B.
Extraordinary growth but does the price compensate for the risks?
There are some questions that many are not asking
🐊 1. Who carries the duration risk?
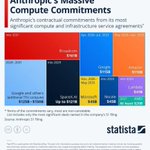
Anthropic has ~$900.9B of compute and infrastructure commitments, with ~$451.6B expected before end-2030 about $106B annually on average. Yet much of its revenue is consumption-based, not locked into long-term contracts.
To be fair, ~$186.2B of commitments have termination rights or conditions. Q3’s issue was too little compute. At Q3’s compute ratio (~58% of revenue), $106B annual spend implies ~$180B revenue. But then again this is a sensitivity, not a forecast.
( refer to attached chart)
Largest named deals from Anthropic’s Oct 26 S-1. Since amended: Google ~$121.3B; total commitments ~$900.9B (Nov 10 S-1/A). Chart: Statista, CC BY-ND.
🐊 2. Are public shareholders in control? No. Founder LLC’s single Class F share carries 50.1% of general voting power. The Long-Term Benefit Trust, with no economic stake, elects four of seven directors. Anthropic is a Nasdaq controlled company.
The Trust can be amended without trustee consent, but only with demanding cross-class approvals.
“You are buying economics, not influence.”
🐊 3. Is $26B from suppliers validation—or strategic alignment?
Google, Nvidia, AMD, Broadcom, Micron, Microsoft and TSMC are investing at the IPO price. That’s less than 3% of Anthropic’s commitments. Several of these investors also appear in the chart attached as Anthropic’s compute counterparties: Broadcom (~$161B), Google (~$121B), Microsoft and AMD.
Real skin in the game but not an independent valuation signal. Class N shares have no underwriter lock-up, though resale restrictions apply.
🐊 4. What are the economics per token?
As a finance person, this is the most imp question for me, unit economics or token economics.
Nine-month operating loss was $1.26B.
Q3’s GAAP operating loss was $567M, attributed mainly to $5B of higher-cost short-term compute and $2B of non-cash donation-matching charges.
Excluding the non-cash charge alone, Q3 would have been roughly $1.4B of operating income.
Near-term liquidity is not the immediate issue: ~$131.9B in cash and short-term investments, plus ~$84.6B estimated net IPO/placement proceeds (at the $74 midpoint, after fees).
Does cost per token fall faster than the price Anthropic can charge?
The breathtaking speed at which tech is changing, I would worry about this question the most
At the top of the range, ~17x October run-rate and ~21x annualised Q3 revenue on a fully diluted basis (~12.6x run-rate on shares outstanding).
🐊 5. How durable is demand—and who owns the channel?
More than 1,900 customers generated at least $1M of trailing revenue; no single customer exceeded 10% of nine-month revenue. Reported NRR is ~900%, using Anthropic’s own qualified-customer metric.
But 44% of nine-month revenue came through cloud marketplaces run by hyperscalers that also sell competing AI products. Quarterly growth slowed from 144% in Q2 to 47% in Q3 still rapid, but slowing sharply.
And $81B run-rate annualises 28 days of consumption fees and one month of subscriptions. It’s a snapshot, not a contract.
My takeaway: Is ~$1.3–1.4T already pricing in years of successful execution? AI may succeed spectacularly and infrastructure suppliers may still capture a disproportionate share of the economics.
Which risk is the IPO price underestimating?
Not financial advice

4
290
🐊 $ASTS Q3 Earnings: My thoughts and main question I have been asking for months now, “The technology is progressing. Are the economics?”
I am invested in $ASTS and have been vocal about the good, bad and the ugly.
Just before the earnings I said that the burden of proof had shifted from technological promise to financial delivery.
So here’s how Q3 measured up.
🐊 THE VERY GOOD
▪️ Japan: ~$1B of non-dilutive J-LEO funding. Management expects most of it in 2027, ahead of satellite and launch spend. ASTS owns 49% of the JV, and capacity not used in Japan runs through ASTS's global network for a low single-digit net revenue share to the JV.
▪️ Manufacturing: targeting 6 ASIC satellites a month from December. ASICs were pulled forward to BlueBird 34 (from 50), with ~10x the processing bandwidth of Block 1. Production is running through BB51, and BB28 is in final stages.
▪️ Government: a ~$100M Space Force contract, 16 US government awards to date, and DPAS priority rating for BB20–25 launching in Q1 2027.
🐊 THE GOOD
▪️ FY26 revenue guidance of $150–200M was maintained, and ~45 BlueBirds in orbit by mid-2027 was reiterated.
▪️ Intermittent US coverage is expected by year-end, with beta trials in early 2027 at ~25 satellites. ▪️ Caveat: in orbit isn't the same as operational, and intermittent coverage isn't commercial service.
🐊 THE BAD
▪️ Revenue miss! Revenue was $42.3M vs ~$46–48M consensus, mostly gateways and government milestones. There's still no recurring carrier or consumer satellite-service revenue. GAAP loss was $0.44/share vs ~$0.40–0.42 expected.
▪️ Hitting $150M needs ~$61M in Q4, about 45% above Q3.
▪️ Q3 capex was $310M (under the guide), but Q4 is guided at $400–500M. Q4 opex excluding cost of revenue is guided at $130–140M, up from $109M.
▪️ Cash plus restricted cash was $3.2B vs ~$3.7B pro forma in June. Reported long-term debt is $4.1B, including the $1.15B July convert.
🐊 THE UGLY
▪️ Blacklift adds "several hundred million" of capex in 2027, on top of the Firefly deal. Management declined to guide 2028.
▪️ There's no total programme cost or payback. The key number: cost per launch on Blacklift vs buying external launches. Why become a rocket company before the network proves it can earn a return?
🐊 WHAT MANAGEMENT DIDN'T ANSWER
▪️ How much carrier revenue does ASTS keep? Still undisclosed.
▪️ J-LEO accounting: "we haven't given a lot of feedback yet."
▪️ The $1.2B US "non-dilutive" pipeline is mostly first-lien or capex-support debt, and not yet secured. Non-dilutive isn't free.
▪️ Total capital needed through 2028, and annual replacement capex.
🐊 MY CHECKPOINTS
Blacklift unveiling (Thu, Nov 12): costs, milestones, funding.
December: is 6 satellites a month actually achieved?
Q4: ~$61M revenue to hit the low end of guidance.
Q1 2027: launches of BB14–25 and the beta.
Next earnings: carrier economics, J-LEO cash flows, 2028 funding.
🐊 CONCLUSION ASTS has shown it can build satellites, attract sovereign funding and secure launches. It hasn't shown that this infrastructure produces sustainable FCF after replacement capex and financing costs. That's the question: not whether ASTS can build the network, but whether shareholders make money owning it.
Still holding. Not averaging down until execution, not price, earns it.
My views only. Not financial advice.
3
356
$ASTS - Thoughts as an investor and someone covering this stock
Disclosure: I’m invested in $ASTS and I write about it. Still underwater, still holding. Q3 results are due after the US close today, Nov 9.
🐊 Where I stand
In September, I wrote that ASTS had remarkable technology, but its share price was pricing in perfection. The question was never just whether the technology works, but whether it can generate attractive returns on the capital required. I said I’d reassess at $35–45. We’re there. So, what’s changed?
🐊 What’s new?
• Rakuten: The JV is 51% Rakuten, 49% ASTS, with up to ¥148B (~$1B) of Japanese J-LEO funding going to the JV, not ASTS. ASTS supplies satellites; service targets March 2029. This validates sovereign demand, though, not ASTS’s balance sheet.
• Blacklift: ASTS plans an in-house reusable rocket for late 2028. The Firefly deal exceeds $1.3B: $400M cash plus 10–14M shares for the licence, $250M for engines and $250M for engineering.
• External launch agreements now cover 100+ satellites across 2027–28.
🐊 The cash question
ASTS had ~$3.7B pro forma liquidity at June 30, including the July convert. H1 capex was ~$860M; Q3 guidance is $350–425M. Add Firefly payments and 50+ satellites in 2027 at ~$22M each.
My assessment: 2027 looks funded; 2028 looks tight. I put the odds of avoiding a large discounted raise through 2028 at ~40%.
We will find out more in today’s earnings call.
🐊 The bottlenecks (my subjective odds)
• ~45 satellites operational, not just launched, by mid-2027: 55%.
• Attractive, disclosed carrier economics: 50%.
• Blacklift flying on time: 25%.
🐊 What investors may be missing
The ~$1.3B backlog isn’t equivalent to recurring service revenue; it includes gateways and government milestones. And satellites wear out. Replacement capex could consume much of the FCF, even if operating margins look attractive.
🐊 The contrarian view
ASTS should prove it can run a profitable satellite network before becoming a rocket company. Vertical integration may help eventually, but adds capital and execution risk today.
🐊 What does $90 require?
Bulls say its a $90 to $100 stock,
At $90, ASTS is worth roughly $35B. At 20x FCF, that’s $1.75B annual FCF. Assume $5.40 retained per subscriber monthly ($12 × 45%) and a 50% FCF margin after replacement capex. That’s ~54M paying subscribers, before government upside.
Possible, but that’s the bar, not a price target.
🐊 What I’m watching tonight
Revenue: Maintain FY26 guidance of $150–200M? H1 was ~$46M, so H2 needs $104M+.
Deployment: Firm dates for 45 operational satellites and upcoming launches.
Cash: Q3 balance, capex, 2027 spending and ATM/dilution.
Commercial: US service date and carrier revenue split.
Blacklift: Total cost and funding. Details may come Thursday, Nov 12. No detail tonight isn’t a red flag; no detail Thursday would be.
Class action and SpaceX lock-up expiry (Dec 8) remain sentiment overhangs, not fundamental risks.
🐊 Conclusion
Still holding. Not because the stock has fallen, but because the opportunity remains. Rakuten strengthens the strategic case; Blacklift adds complexity. The thesis is alive, but the burden of proof has shifted from technological promise to financial delivery.
My views only. Not financial advice.
2
3
404
When even gold starts behaving like a risk asset, what does that mean?
I am invested in gold / gold mines, significantly, and Thursday's Nasdaq plunged 5.5%, wiping out roughly $2.5T in market value. Gold, which had been rallying hard into the week, gave back part of that gain as the selloff intensified holding up better than equities, but still retreating from its highs at the exact moment stocks were cratering. Silver fell outright.
Gold is supposed to be the hedge. When a safe haven gives up gains while stocks are falling hardest, one explanation is forced liquidation: investors facing margin calls sell whatever's liquid to raise cash including positions that are still profitable. Gold's depth makes it collateral as much as a safe haven.
We've seen this before 2008, March 2020 correlations spiking together in the first wave of panic, then decoupling again.
Add insult to injury:
Friday's gold dip (-0.7%) was also impacted by October jobs report that pushed December rate-hike odds toward 80%, a classic reason for gold to fall on its own.
The real question isn't whether the AI trade is dead it's whether Thursday was a one-day flush or the start of broader deleveraging. And with the Fed now leaning toward a hike rather than a cut, there's less room for easy money to cushion the AI trade if this is more than noise.
Three things I'm watching:
▪️ VIX normalizing or still elevated?
▪️ Credit spreadscontained to equities, or spreading?
▪️ Cross-asset correlations back to normal, or still moving together?

4
183
🐊 THE NEW AI BOTTLENECK IS PERMITS.
For the past few years, the AI investment thesis revolved around supply chains: GPUs, HBM, networking, optics and advanced packaging.
Now another bottleneck is emerging:
the ability to actually build AI infrastructure.
Texas is the clearest example. The state has already restricted data-centre approvals, grid connections and environmental permits. Following Gina Hinojosa’s election victory, the prospect of an extended permitting freeze adds another layer of uncertainty.
The market is still deciphering what this means.
🐊 EXISTING BECOMES MORE VALUABLE
If new capacity becomes harder to approve, existing permits, secured power and operational campuses become more valuable.
This is not necessarily a demand problem. It is a supply-side constraint.
And it creates an important distinction between companies with shovel-ready infrastructure and those with ambitious development pipelines.
🐊 WHY THE SELL-OFF MAY BE TOO BROAD
Nebius is an interesting example.
Its key infrastructure projects are outside Texas, meaning it does not have the same direct exposure to the Texas permitting freeze.
Yet companies like Nebius are getting smoked alongside developers facing more immediate regulatory obstacles.
That does not make Nebius immune. Financing, construction, customer concentration and execution remain real risks.
But if the market is indiscriminately repricing AI infrastructure companies, geography and permitting exposure may matter more than investors currently appreciate.
🐊 THE THESIS IS NOT BROKEN. IT HAS AN EXTRA HOP.
AI demand still requires compute.
Compute requires data centres.
Data centres require power, grid connections, land, permits and infrastructure.
The investment thesis has not disappeared. It has become more complex.
The extra layer of permitting and regulatory risk could push timelines out, increase costs and change which companies capture the economics.
🐊 WHERE I’M LOOKING
▪️ Companies with existing permits and secured power.
▪️ Non-Texas infrastructure developers with credible execution.
▪️ Power generation, electrical equipment and grid infrastructure.
▪️ Developers whose share prices imply a much worse outcome than their underlying projects justify.
The key distinction: a permitted site with power is not equivalent to a speculative pipeline of future megawatts.
The market may be right to demand a higher risk premium.
But when it prices every AI infrastructure company as if the same bottleneck applies, it may create opportunities.
The question is no longer simply who has the best chips.
It is who can actually get the infrastructure built.
Not financial advice.
3
242
🐊 LUMENTUM ($LITE): Is getting smoked, after $MRVL deal, Is there an opportunity?
I’ve owned Lumentum and written about photonics for a while. In my previous post, I questioned whether Marvell ($MRVL) could justify the financial burden of acquiring LITE. The strategic logic made sense. The economics were my concern.
That concern has intensified.
$MRVL’s share price has come down by circa 32% and LITE has come come down circa 26% 😏
🐊 What is happening?
The definitive all-stock deal offers 4.5 MRVL shares per LITE share. The $1,132 headline value was based on MRVL’s unaffected October 28 close of $251.65.
But MRVL closed at $171.41 on November 2. That puts the implied LITE consideration at approximately $771. LITE closed at $684.40, an 11.3% discount.
The original 23.9% premium has effectively disappeared. LITE is now trading below its pre-deal reference value.
🐊 The MRVL connection
Every $10 move in MRVL changes LITE’s implied merger value by $45. This is a fixed exchange ratio, not a guaranteed cash payout.
If MRVL falls further, LITE’s implied consideration falls with it. Until closing, I’m effectively exposed to Marvell’s share price, alongside the risk that the deal fails.
🐊 What are investors worried about?
▪ Marvell’s shareholders must approve a massive acquisition after MRVL has already fallen sharply.
▪ Integration, manufacturing capital intensity and capacity capex.
▪ Regulatory approvals, including potential Chinese review and delays.
▪ Customer conflicts. NVIDIA invested $2B in Lumentum. What happens when its optical supplier becomes controlled by a custom-silicon competitor?
▪ Whether the promised $1B+ synergies and year-one EPS accretion actually materialise. These remain management targets, not guarantees.
🐊 My perspective
I bought LITE for its underlying photonics business, not a speculative takeover premium.
Lumentum’s
Q1 FY2027 revenue reached $1.26B, up 136.5% YoY. Q2 guidance points to $1.575B–$1.625B.
The business is not suddenly collapsing.
But if the deal closes, I won’t own a photonics pure-play. I’ll own approximately a third of a combined Marvell business.
🐊 What next?
I dont have a choice but to monitor
- MRVL’s valuation,
- LITE’s revenue and margins,
- shareholder votes,
- regulatory developments,
- capacity capex and
- NVIDIA’s response.
I’m not rushing to average down. The underlying business remains strong, but the financial structure of this deal has materially changed my investment thesis.
The question is no longer just how much photonics will grow. It’s who captures the economics, and at what price.
I own LITE. Not financial advice.
The market sold $APLD as just another neocloud. Perhaps it was afraid of Coreweave and overall tech bearish sentiment.
APLD owns no GPUs. It collects rent on 15-year take-or-pay leases. The question may be less about what it builds and more about who pays for it, and today that's almost entirely one tenant whose own credit is under strain.
I modelled the equity: roughly $15/share probability-weighted, a touch below the ~$18 it traded at when I wrote it. Perhaps not a bargain yet, but closer than the selloff suggests.
stockcrock.substack.com/p/co…
1
2
449