

https://teapawt.net/t.co/zJ80N57BCl || Find Sector Leaders, RS and Stage 2 winners before the crowd. Built for independent investors who refuse to be mediocre.
India
Joined February 2026
- Tweets107
- Following50
- Followers3
- Likes58


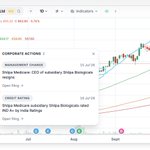


Bookmark first and thank me later
wealthlab.in

4
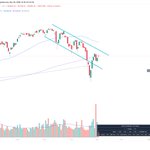
A/D oscillator on WealthLab , after showing consistent negative and extreme readings, can now show a total turn of events.
The worst might be behind us, every extreme red day, is an opportunity to buy.

1
5
Plot ratios on any chart
Type = in a chart's search to plot a ratio like TCS / Nifty IT, without leaving the page you're on.
AMAZING FEATURE RELEASES!
📊 New on WealthLab: P/E, P/B and Dividend Yield indicators for every Nifty index, daily since 2012, with median and ±σ bands.
Plus a P/E column and an Excel export on the Nifty Indices table. Find it under Indicators → Fundamentals ✨
22
#ADVANCE breaking out of an IPO Base.
What is an IPO base?
An IPO Base Breakout occurs when a stock that has recently gone public forms a consolidation base and then breaks above its resistance with strong price and volume.
1/n

This setup suggests that the stock is finding support from buyers after its initial public listing, and demand may be starting to outweigh supply. A breakout backed by strong volume and improving relative strength can signal the beginning of a new uptrend.
2/n
1
18

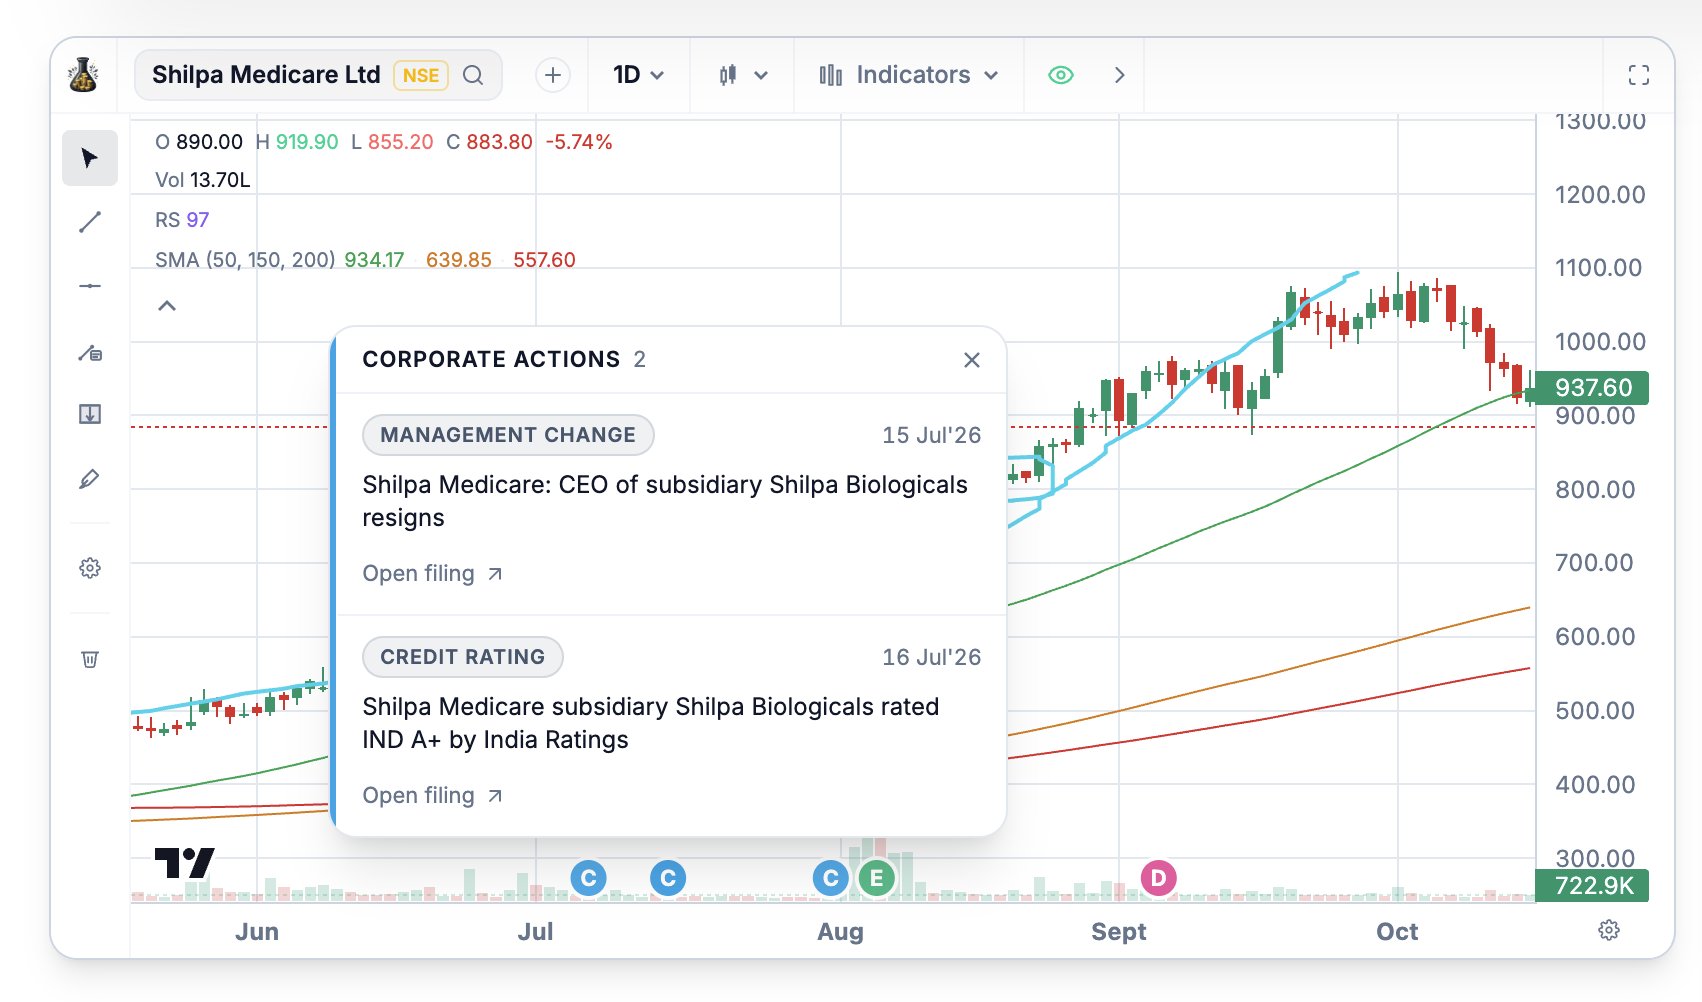


Most traders use Relative Strength WRONG ❌
The right way ✔️
1️⃣ Rank sectors by RS
2️⃣ Pick the top sector
3️⃣ Find the strongest stock inside it
4️⃣ THEN look for entry
RS Rankings tool → wealthlab.in
Full video → youtu.be/m_ASZmTKF8I

41
Metal sector is now losing steam after a good five-month run.
This usually happens when gold and silver start topping out and people start losing hopes and dreams in other metals as well.
Shared via wealthlab.in

24
FMCG stocks now at 7 from 2 in the stage 2 list.
Pharma picking up.
Both are defensives.
Watch out!

17
🚀 *New Feature: Stock Tracking List!*
You can now build your own personal watchlist right inside the app! Here's what's new:
👁️ *Track any stock* from its detail page or directly from search — no page switching needed

1
13
📋 *Your Tracking Page* shows all your stocks with price, RS, sector, market cap, P/E, EPS growth & ROE at a glance
🔍 *Filter & sort* by sector, industry, market cap, RS, and more
📊 *Analytics section* breaks down your portfolio by sector & market cap vs the broader market
1
11