

Economics & data analysis Evidence over narratives | charts & comparisons Türkiye-focused account: @World_Data_A_TR
World
Joined June 2025
- Tweets19K
- Following2K
- Followers6.5K
- Likes229K




Pinned Tweet
Could the world’s most dangerous conflict be Taiwan?
Yes! the world cannot absorb this conflict...
In the quoted post, several Taiwan-related variables appear to converge around 2027. It may not be visually sophisticated, but it carries a very important strategic message.
The intersection of military modernization goals, the declining probability of peaceful reunification, and the changing balance of deterrence all seem to point to the same date.
This is worth keeping in mind as we continue the Taiwan discussion.
Taiwan
Not Ukraine. Not Russia. Not even the Gulf wars.
The most dangerous conflict the world may still not be fully prepared for is Taiwan.
Because this is not only a territorial dispute.
It sits at the intersection of:
history
identity
unfinished civil war
Japan’s colonial legacy
China’s rise
the Koreas semiconductor production
global shipping
East Asia’s industrial system
And because of that, the rest of the world would not be a spectator.
Some historical background
Taiwan passed through several defining phases.
First, after the First Sino-Japanese War, Taiwan was ceded to Japan in 1895 and remained under Japanese rule until 1945. During this period, Japan industrialized the island, expanded railways, sanitation, sugar production, and education, deeply shaping its modern economic structure.
After Japan’s defeat in World War II, Taiwan was placed under the Republic of China (ROC) with Allied and U.S.-backed postwar arrangements.
Then came the decisive break: after the Chinese Civil War, the KMT retreated to Taiwan in 1949, while the People’s Republic of China was established on the mainland.
Why are people of the same civilizational root in conflict?
This is perhaps the deepest question.
At the cultural and ethnic level, there are major overlaps:
Han Chinese roots
migration waves from Fujian and Guangdong
later mainland migration after 1949
strong Japanese institutional legacy
a distinct Taiwanese civic identity today
Taiwan identiy
So the conflict is less about ethnicity and more about:
political legitimacy, sovereignty, and future alignment.
The identity trend now makes this divide even more structurally complex.
As the chart shows, the share of people identifying as Taiwanese only has risen from below 20% in the early 1990s to above 60% by 2025, while those identifying as Chinese only have fallen to nearly negligible levels.
This suggests that Taiwan is no longer shaped only by historical migration roots or civilizational continuity.
A distinct political and civic identity has clearly consolidated over time.
This makes the issue even more sensitive, because any conflict scenario would not only be about sovereignty claims, but also about a population that increasingly sees itself as politically separate.
Why the world is not ready The danger is not only military.
And... a conflict here would directly affect:
China
Japan
South Korea
both Koreas indirectly
Europe
U.S.
Chart source: @nccu1927


🇹🇼🇨🇳🇺🇸 ⏰⚔️
A strategic perspective and chart...
Why 2027 matters: When strategic “clocks” start ticking together (Taiwan, China and USA)
We may have massive crisis in 2027❗️❗️❗️
🔴 Peaceful unification window is closing: The declining red line highlights shrinking prospects for peaceful reunification as Taiwanese identity and resistance harden over time.
🟠 #Military leverage is rising: The orange line shows China’s growing perception of military advantage, reinforcing incentives to rely less on diplomacy.
🟢 #PLA modernization peaks around 2027: The rising green line reflects the PLA’s centenary goal, operational readiness for major contingencies by 2027.
🔵 Leadership timing matters: The flat blue line signals the end of Xi Jinping’s third term in 2027, a natural legacy checkpoint for decisive action.
⚖️ Clock synchronization risk: The intersection in 2027 illustrates how political timelines, military readiness, and declining peaceful options align for the first time, raising contingency risk even without an official declaration.
📌 The chart does not predict war but it explains why 2027 has become a focal point in Western and regional assessments. It is the year when multiple strategic timelines converge, making it the earliest plausible moment for #Chinese military action against #Taiwan, should #Beijing conclude that peaceful unification is no longer achievable ❗️❗️❗️
#USA #China #UnitedStates
Source: @INSSIsrael

.
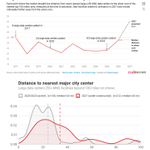
Data centers haven’t left the city yet, means rural land opportunities are just getting started
Large data centers are still staying close to big cities. They have not moved out into the countryside in a big way.
Top chart: The timeline (2017–2027)
This line graph shows how the distance of new data centers from the city center is changing over the years.
* 2017–2025: For nearly a decade, new data centers stayed relatively close to the city. The median distance hovered around 24 miles, meaning exactly half of the new data centers were closer than 24 miles, and the other half were farther.
* 2027 Projection: A massive jump is coming. The median distance spikes to 34.2 miles. This tells us that the middle point has shifted significantly out, and now half of all planned 2027 data centers will be built at least 34.2 miles or deeper away from the city center.
Bottom chart: The comparison (2020–2023 vs. 2027)
This distribution graph compares where facilities were built in the past versus where they are being built for 2027.
- 2020–2023 (grey line): Most data centers built in this period were tightly packed close to the city, creating two high peaks between 10 and 25 miles away. Very few were built past 40 miles.
- 2027 under construction (red line): The new projects are much more spread out. The peak is lower and flatter, meaning a huge number of facilities are pushing much deeper into rural areas, stretching all the way out to 40, 60, and even 100 miles away.
Source: Realtor com, Aterio Data Center Inventory

Another fantastic analysis from @Eco3min
This chart shows why looking at economic data in real time is different from looking at it later.
What the chart compares
- Top bar: The official story using revised data (what we see today).
- Bottom bar: What the same model said at the time, using only the data available that month.
Key finding
Out of 184 months, the two versions disagreed in 37 months. That means roughly 1 in 5 months the story looked different depending on whether you used real-time data or the later revised numbers.
What the colors mean
- Green = Healthy growth
- Red = Economy running too hot or inflation pressure
- Gray = Slowing down or mixed signals
- Blue = Growth with falling inflation
Why it matters
Policymakers and investors have to make decisions with the data available at the time. Later revisions can change how we remember that period. This chart shows that the difference is not rare, it happens often enough to matter.

.
The US has barely changed refining capacity, while Europe has cut it!
Since 2010, refinery capacity trends have diverged sharply by region.
Cumulative change in refining capacity (thousand barrels per day)
China: +6,500
Middle East: +3,700
United States: +400
Europe: –3,000
China and the Middle East have added substantial refining capacity. The United States has seen only a modest net increase, while Europe has reduced capacity by roughly 3 million barrels per day.

World Data Analysis retweeted

Norms of inquiry vs pure emotional allegiance
Norms constrain power. Devotion justifies power
Healthy systems require: Commitment to community but also, submission to rules & procedural limits
Devotion w/o norms becomes fanaticism
Norms w/o devotion become hollow bureaucracy
.
Critical breakthrough in electric vehicle batteries
Scientists have developed a smarter battery design for electric cars. In normal batteries, one weak cell slows down the whole pack. The new system uses switches to bypass bad cells and keep using the healthy ones.
This can make the battery last more than 20% longer. In one test case, it delayed the need for a battery replacement by 14 months.
The design costs about 9% more to build, but it can still save money over time. It also helps old batteries work better in second-life uses, such as energy storage.
Source: @EnergyInstitute

World Data Analysis retweeted

🌐Yaptırıma Tabi Tankerlerin Son Rotası: Gemi Sökümü, ZOMBİ TANKERLER ve Gölge Filo Kimlik Aklama Yöntemleri Hk. Bilgi Notu:
📌OFAC yaptırımlarından dolayı Bangladeş'te söküm işlemi gerçekleştirilemeyen MAYMEI (IMO: 9133082) isimli ürün tankeri son olarak Hindistan'ın Alang gemi geri dönüşüm bölgesine götürülüp söküme alınmıştır. 29 yaşında ve ~45.000 DWT'lik tanker İran petrokimya ürünlerinin taşınmasıyla ilgili seyrüseferler gerçekleştirdiği için Mayıs ayında OFAC'ın yaptırım listesine alınmıştır. Tanker OFAC'ın yaptırım kararından altı gün önce Bangladeş'in Chattogram limanına söküm amacıyla ulaşmıştı.
📌OFAC kararıyla birlikte,
🔸Bangladeşli alıcı satın alma işleminden caymıştır.
🔸Banka akreditifi iptal edilmiştir.
🔸Gemi söküm izni iptal edilmiştir.
🔸Ardından gemi Hindistan'daki Alang gemi söküm bölgesine götürülüp söküm işlemine başlanmıştır.
📌Burada size Yaptırım Rejimleri ve Gölge Filolar ile ilgili olarak yeni bir hususu göstererek konuya dikkat çekmek istiyorum. Bakınız yaptırımlar gemilerin ekonomik ömürlerinin son aşamasını dahi etkilemektedir. Gemi imha edilecek ve söküm hizmetinden bir değer ortaya çıkacak, bu değerin bile hedef ülkenin kasasına girmemesi gerekmektedir.
🔸Yani yaptırım rejimi derken anlatmaya çalıştığımız konu fark edilenden daha derin bir ilişki biçimine dönüşmektedir. Tankerlerin hangi yükleri, hangi rotalarda taşıyacağını, hangi şirketlerle, hangi sigorta kuruluşlarından faydalanabileceğini ve hangi tersanelerde bakım-onarıp görüp hangi pazarlara erişebileceğini kısıtlayabilirsin, daha ötesinde hangi koşullarda ticari dolaşımdan çıkarılacağını da kısıtlamanız gerekmektedir.
📌Ancak tam da bu noktada yaptırım rejimleri açısından daha ciddi bir güvenlik açığı ortaya çıkmaktadır. Buna literatürde Vessel Identity Laundering denmektedir, geminin kimliğinin aklanmasıdır. Uluslararası deniz taşımacılığında gemilere verilen IMO numaraları kalıcıdır. Gemi adı, bayrağı, sahibi veya işletmecisi değişse bile IMO numarası asla değişmemektedir. Bu geminin parmak izi gibidir. Gemi söküm işleminden sonra sökülen gemilerin IMO numaraları ise başka gemilere yeniden tahsis edilememektedir. Daha doğrusu edilmemesi gerekmektedir. :)
📌Fakat Gölge Filo olgusunda bu kuralın sistematik biçimde istismar edildiğini de gözlemliyoruz. Örneğin Aralık 2024'te sökülmüş tankerlere ait 19 IMO numarasının aktif olan ve işletilen gemiler tarafından kullanıldığı tespit edilmiştir. Bunu Lloyd's List yazmıştır. Dahası mı? Aralık 2025'te bu sayı 46'ya yükselmiştir. Bu yöntemle yaptırımlı tankerler fiziksel olarak varlığı sona ermiş başka gemilerin kimlik bilgilerini kullanarak ticari faaliyetlerini farklı bir gemi kimliği altında sürdürmeye devam etmektedir. Yani ZOMBİ TANKERLER ortaya çıkmaktadır. Gerçekten de literatürde bu gemilere "Zombie Ships/Vessels/Tankers" olarak hitap edilmektedir.
📌 Peki gemi söküm tesisleri bu kritik konuda nasıl bir rol oynayabilir?
📌Gemi söküme gönderilen bir geminin,
🔸Gerçekten fiziksel olarak sökülüp sökülmediği,
🔸Sökümün resmi kayıtlarla doğrulanıp doğrulanamadığı,
🔸Sökülen gemiye ait kimlik bilgilerinin daha sonra başka gemiler tarafından kullanılıp kullanılmadığı,
🔸Geri dönüşüm amacıyla satılan bir geminin sökülmeden yeniden deniz taşımacılığına katılıp katılmadığı dikkatlice denetlenmelidir ki hemen hemen dünyanın hiçbir yerinde gemi söküm pazarında böylesine bir kamusal denetim yoktur.
📌Yaptırım rejimleri tankerlerin uluslararası deniz ticaretinde faaliyet göstermesini kısıtlarken bu gemilerin sabit sermaye olarak taşıdığı ekonomik değeri ortadan kaldırmamaktadır. Bir taraftan deniz taşımacılığından dışlanan tankerler hurda çelik ve geri dönüştürülebilir madenler üzerinden yeniden ekonomik değere dönüştürülmektedir. Diğer taraftan ise fiziksel olarak sökülmüş gemilere ait kimlikler yaptırım altındaki başka tankerlerin deniz taşımacılığı yapabilmesi için araçsallaştırılmaktadır.
📌Bu nedenle yaptırıma tabi sabit sermayenin deniz taşımacılığından gerçekten çıkarılıp çıkarılmadığı ve fiziksel olarak ortadan kalkan gemilere ait kimliklerin başka tankerler üzerinden yeniden dolaşıma sokulup sokulmadığı kritik bir konu haline gelmektedir.
📌Aşağıdaki görüntü Hindistan'ın Alang gemi söküm tesisinden bir görüntüdür. Sizce bu tarz noktalarda geminin kimliği kolayca aklanamaz mı? Bu sadece basit bir kimlik değişimidir.

World Data Analysis retweeted

This is why you can't trust your coworkers they will knife you in the back any chance they get
You leave your desk for half an hour. No drama, no missing deadlines, just gone long enough to handle something. Next thing you know HR is sliding into your messages asking for an explanation because “we received a report.”


World Data Analysis retweeted

The Dangote Incursion: How Africa’s Richest Industrialist Is Reshaping Kenya🇰🇪’s Energy Future Amid Land Disputes and Privatization Questions africaupdates.com/news/the-d…

.
A very important finding for the US
Since January 2025, the non-citizen population in the United States has declined steadily, while the number of naturalized citizens has continued to rise.
Naturalization is the legal process by which a non-citizen becomes a U.S. citizen
Key numbers (in millions)
- Non-citizens: 27.3 (Jan 2025) to 23.8 (Jul 2026)
- Naturalized citizens: 26.0 (Jan 2025) to 26.7 (Jul 2026)
The drop in non-citizens (3.5 million) is much larger than the increase in naturalized citizens (0.7 million) over the same period. This means a significant portion of the decline in the non-citizen population is likely due to people leaving the country, deportations, or other factors, not only naturalization.
While some non-citizens are becoming citizens, the data show that the overall non-citizen population is shrinking at a faster pace than can be explained by citizenship alone.
Source: @CIS_org by Steven A. Camarota and Karen Zeigler

World Data Analysis retweeted

Beyond the tailpipe: automakers’ role in driving steel decarbonisation opportunitygreen.org/climate…

World Data Analysis retweeted

✨🐦⬛✨👀✨


.
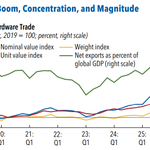
AI’s share of world output is approaching a critical threshold: Is the world ready?
AI hardware trade has surged in recent years. The nominal value index has roughly tripled since 2019, while net exports of AI hardware have risen to about 0.40% of global GDP.
BUT, most of the recent WTO and UNCTAD numbers (the ~15–17% share) refer to AI-enabling goods as a share of global merchandise trade.
That share is still small. For comparison, oil trade has historically hovered around 1–2% of global GDP in normal periods. However, the trajectory is steep, and the supply chain is highly concentrated: a handful of countries and firms account for the bulk of both net exports and net imports.
If the share continues climbing toward 0.5–1% of global GDP, AI hardware would move from a niche category into the range of strategically systemic trade flows. At that point, the combination of rapid growth and extreme concentration would make the sector far more consequential for supply-chain security, industrial policy, and geopolitical risk than its absolute size alone suggests.
Source: @IMFNews

World Data Analysis retweeted

Attended last sunday evening a very impressive and colorful ballet performance by K-Ballet Tokyo in Manila Samsung Hall; also to commemorate the 70th anniversary of the normalization of Japanese-Philippine diplomatic relations. @kballetofficial @NLinPhilippines @AmbJPNinPH


.
Even if the tension isn’t always visible on the surface, NATO’s current European command structure surprises many Europeans
Current vs. Proposed
In the present Allied Command Operations structure, the United States leads the large majority of key positions:
SHAPE (Supreme Headquarters Allied Powers EU) US
JFC Naples US
JFC Norfolk US
AIRCOM US
LANDCOM US
SOFCOM US
STRIKFOR NATO US
European-led commands are limited to a handful (JFC Brunssum, JSEC, and MARCOM)

A proposed future structure would shift SHAPE to European leadership and reorganize the commands into regional European-led Joint Force Commands (Centre, North, South) with their subordinate air, land, maritime and other components also under European lead.
The charts illustrate how heavily the current operational structure still relies on American command, even within Europe.
Source: @ecfr by Rafael Loss, @mprochwicz and @jana_puglierin

World Data Analysis retweeted

Reaping what you grow: rethinking apoptosis in cortical folding academic.oup.com/cercor/arti…

World Data Analysis retweeted

Another sweep to #5Nordics...
The US #33...

Youth Progress Index 2025
1. Norway🇳🇴
2. Denmark🇩🇰
3. Finland🇫🇮
4. Iceland🇮🇸
5. Sweden🇸🇪
6. Switzerland🇨🇭
7. Germany🇩🇪
8. Netherlands🇳🇱
9. Luxembourg🇱🇺
10. Ireland🇮🇪
11. Belgium🇧🇪
12. Austria🇦🇹
13. Australia🇦🇺
14. Japan🇯🇵
15. Slovenia🇸🇮
16. Estonia🇪🇪
17. Singapore🇸🇬
18. New Zealand🇳🇿
19. Korea🇰🇷
20. Czechia🇨🇿
21. UK🇬🇧
22. Canada🇨🇦
23. Portugal🇵🇹
24. France🇫🇷
25. Lithuania🇱🇹
26. Spain🇪🇸
27. Italy🇮🇹
28. Malta🇲🇹
29. Cyprus🇨🇾
30. Latvia🇱🇻
31. Poland🇵🇱
32. Israel🇮🇱
33. USA🇺🇸
34. Croatia🇭🇷
35. Slovakia🇸🇰
36. Greece🇬🇷
37. Costa Rica🇨🇷
38. Uruguay🇺🇾
39. Chile🇨🇱
40. Hungary🇭🇺
41. Argentina🇦🇷
42. Montenegro🇲🇪
43. Serbia🇷🇸
44. Barbados🇧🇧
45. Romania🇷🇴
46. Bulgaria🇧🇬
47. UAE🇦🇪
48. Armenia🇦🇲
49. Kuwait🇰🇼
50. Malaysia🇲🇾
51. Qatar🇶🇦
52. Moldova🇲🇩
53. Oman🇴🇲
54. Panama🇵🇦
55. Brazil🇧🇷
56. Mauritius🇲🇺
57. North Macedonia🇲🇰
58. Georgia🇬🇪
59. Albania🇦🇱
60. Kazakhstan🇰🇿
61. Jamaica🇯🇲
62. Trinidad and Tobago🇹🇹
63. Belarus🇧🇾
64. Ukraine🇺🇦
65. Vietnam🇻🇳
66. Bosnia and Herzegovina🇧🇦
67. Colombia🇨🇴
68. Bahrain🇧🇭
69. Thailand🇹🇭
70. Saudi Arabia🇸🇦
71. Mexico🇲🇽
72. Indonesia🇮🇩
73. Paraguay🇵🇾
74. Algeria🇩🇿
75. Cuba🇨🇺
76. Russia🇷🇺
77. Jordan🇯🇴
78. Ecuador🇪🇨
79. China🇨🇳
80. Kyrgyzstan🇰🇬
81. Uzbekistan🇺🇿
82. Sri Lanka🇱🇰
83. Maldives🇲🇻
84. Fiji🇫🇯
85. Suriname🇸🇷
86. Dominican Rep.🇩🇴
87. Peru🇵🇪
88. Türkiye🇹🇷
89. Philippines🇵🇭
90. Bhutan🇧🇹
91. Tunisia🇹🇳
92. Mongolia🇲🇳
93. Cabo Verde🇨🇻
94. Azerbaijan🇦🇿
95. Morocco🇲🇦
96. South Africa🇿🇦
97. Lebanon🇱🇧
98. Bolivia🇧🇴
99. Guyana🇬🇾
100. El Salvador🇸🇻
101. Botswana🇧🇼
102. Honduras🇭🇳
103. Iran🇮🇷
104. Turkmenistan🇹🇲
105. Guatemala🇬🇹
106. India🇮🇳
107. Tajikistan🇹🇯
108. Egypt🇪🇬
109. Ghana🇬🇭
110. Namibia🇳🇦
111. Venezuela🇻🇪
112. Iraq🇮🇶
113. Sao Tome and Principe🇸🇹
114. Nicaragua🇳🇮
115. Libya🇱🇾
116. Nepal🇳🇵
117. Timor-Leste🇹🇱
118. Kenya🇰🇪
119. Cambodia🇰🇭
120. Gabon🇬🇦
121. Senegal🇸🇳
122. Bangladesh🇧🇩
123. Tanzania🇹🇿
124. Solomon Islands🇸🇧
125. Laos🇱🇦
126. Rwanda🇷🇼
127. Nigeria🇳🇬
128. Côte d’Ivoire🇨🇮
129. Myanmar🇲🇲
130. Zambia🇿🇲
131. Gambia🇬🇲
132. Benin🇧🇯
133. Djibouti🇩🇯
134. Syria🇸🇾
135. Lesotho🇱🇸
136. Pakistan🇵🇰
137. Eswatini🇸🇿
138. Uganda🇺🇬
139. Comoros🇰🇲
140. Malawi🇲🇼
141. Cameroon🇨🇲
142. Zimbabwe🇿🇼
143. Togo🇹🇬
144. Papua New Guinea🇵🇬
145. Angola🇦🇴
146. Equatorial Guinea🇬🇶
147. Mauritania🇲🇷
148. Sudan🇸🇩
149. Mozambique🇲🇿
150. Ethiopia🇪🇹
151. Burkina Faso🇧🇫
152. Yemen🇾🇪
153. Congo🇨🇬
154. Liberia🇱🇷
155. Sierra Leone🇸🇱
156. Guinea-Bissau🇬🇼
157. Mali🇲🇱
158. Niger🇳🇪
159. Congo, D.R.🇨🇩
160. Madagascar🇲🇬
161. Haiti🇭🇹
162. Guinea🇬🇳
163. Burundi🇧🇮
164. Eritrea🇪🇷
165. Somalia🇸🇴
166. Afghanistan🇦🇫
167. Chad🇹🇩
168. Central African Rep.🇨🇫
169. South Sudan🇸🇸
@Youth_Forum


ASEAN Countries’ contribution to the bloc’s total GDP and absolute GDP figures (Billion USD, 2026 projections)
In the quoted post, we saw how citizens of ASEAN countries perceive the economic output generated by their nations. Here, however, we look at the actual shares each country holds in ASEAN’s total GDP.
As the map shows, the distribution is extremely uneven, spanning from nearly half the total to fractions of a percent.
Countries’ share in ASEAN’s total GDP
🇮🇩 Indonesia: 32.78%
🇸🇬 Singapore: 14.79%
🇹🇭 Thailand: 13.20%
🇲🇾 Malaysia: 12.12%
🇻🇳 Vietnam: 12.01%
🇵🇭 Philippines: 11.11%
🇲🇲 Myanmar: 1.84%
🇰🇭 Cambodia: 1.2%
🇧🇳 Brunei: 0.42%
🇱🇦 Laos: 0.41%
🇹🇱 Timor-Leste: 0.05%
Indonesia accounts for 32.78% of ASEAN’s total GDP, almost as much as Singapore, Thailand, and Malaysia combined.

.
Member States’ contribution to ASEAN’s long-term development and progress
Singapore leads by a wide margin, accounting for 64.4% of the contribution, followed by Indonesia at 41.0%.
Thailand (26.1%) and Malaysia (26.0%) form the next tier, while Vietnam contributes 14.4%. The remaining members, Philippines, Brunei, Cambodia, Laos, and Myanmar, each account for less than 10%.
The figures highlight the outsized role of Singapore and Indonesia in driving ASEAN’s long-term economic development relative to the other member states.
Source: @ISEAS
