

i have pride despite my dismal circumstances
SE AZ, USA
Joined May 2019
- Tweets2.2K
- Following349
- Followers421
- Likes15.1K






jason retweeted

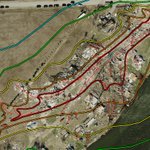
As a very avid DAT user, I’ve been using the updated Damage Assessment Toolkit for about a day now, and I wanted to share my thoughts so far.
Pros:
• Damage photos load significantly faster.
• The filtering feature is much better.
• The bookmark feature is pretty neat and useful for immediately being directed to specific cases or outbreaks.
Cons:
• Loading data feels more cumbersome and slower.
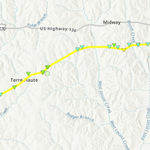
• The quality of paths and points on the map appears worse than before. I’m noticing significantly more pixelation.
• Basemap quality also seems to have decreased.
• The updated DAT relies more heavily on newer ArcGIS features, particularly the pop-ups, which I personally don’t care for.
• Zooming in and out feels overly sensitive, and it seems to take longer for data to load afterward.
• The measurement tool currently does not work.
• Tornado paths are too thin and, in my opinion, should be a bit thicker.
• The date box is weirdly cut off in the top-right corner.
• Damage Indicators (DIs) appear as smaller now, and the EF0 DI color was changed for no apparent reason.
• When overlaying data from the "Add Data" feature, it covers tornado paths, points, and polygons.
• You can't manually type in a date range anymore.
Overall, I’m not particularly impressed with the UI changes or the update as a whole. It honestly feels a bit like a case of fixing something that wasn’t broken, it seems like a step back to the DAT from the 2019-2020 era. That said, I’m not sure who is currently responsible for these changes, or whether they’re actively looking for feedback from frequent DAT users. Also, I’m pretty sure this update had to be done because ESRI’s Web AppBuilder was deprecated.
I’d also be interested to hear from NWS meteorologists who utilize the DAT regularly: What are your thoughts on the update?
And just to clarify, I’m not trying to come across as rude or overly negative with these criticisms. I’m simply sharing my honest thoughts from the perspective of someone who uses the DAT very frequently, as well as someone looking at the changes from a human-factors perspective. There are some improvements here, but I think there are also several areas that should be reconsidered if possible.


Genuinely what are you even saying anymore? Cycloidals are perfectly calculable but not at all in whatever sense you are trying to apply here. There is no "recipe for EF5 intensities" in cycloidals. It is simply the rotational velocity and forward speed that determines them.
unavailable
Ran out of words: Theres more to it than rotational velocity and fwd speed, swirl ratio is also an important factor. The cycloidals here aren't even calculable at that low of a resolution.
Feel this would be a lot cooler of a finding if photogrammetry was on a 3-second basis (which is what the EF scale uses) rather than instantaneous. A lot of tornadoes including weak ones likely exceed 200 MPH regularly on that sort of scale, but it doesn't reflect on true speeds.


youtube.com/watch?v=LxJZgkJL… Insane video of the 2013 Moore EF5 as it intensified before inflicting its first EF4 indicators.
