

Founded one of the first synthetic grass & golf systems companies in the US in 1998. I consult on large golf systems projects world-wide. Avid crypto investor.
Joined January 2022
- Tweets15.8K
- Following482
- Followers7.8K
- Likes23.7K



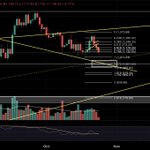


Focus on the bullish RSI divergence on the 4H chart for $BTC. RSI is rising while the price has been relatively flat within a small range. That is an indicator of an asset that isn't going to go much lower in price in my analysis.
There are three areas of major confluence at my general target:
- The .702 fib retracement
- Two structural rails, one being a 9 year support level.
Even if Bitcoin pushes down to my target area, that won't be enough to reverse the overall RSI trend.
I still think a bottom is near with this correction as this could end up being your classic weekend bear trap followed by a reversal on Monday.
As always, let's see how it all plays out:)

This looks to be setting up as a Livermore pivot retest of the structure midpoint from underneath for $BTC.
Watch spot candle volume if and when it hits that level.

Here's the macro structure for $BTC once again. You can see why I'm pretty confident that price will hold in the general area that it's currently at, even if we see a small push below the lower rail of this macro rising wedge structure:)

I haven't talked about $IOTA for quite some time as it's been a longer term hold for me. This is exactly what you want to see as far as structure goes.
It's a macro falling wedge pattern combined with very bullish RSI divergence since May of 2022 on the daily chart.

The $ZEC price has worked just below the .786 trend based fib chart. My expectations are still a minimum correction to around the 1K level as that would be the healthiest behavior. If it doesn't do that now, it could certainly fall much harder later.
Will it push below 1K to the lower target around $700? Hard to say at this point but if it's following the general market trend currently, and that trend is about to bottom, then 1K would probably be as low as price goes.
If the entire market continues to correct, well below the target areas I have for most of the assets I'm following, then everything will have to be re-evaluated at that point and Zcash could easily hit the lower target.
I don't expect a larger market correction, but if that happens, it would indicate a much weaker market than I thought.

$LTC price has now pushed into the target zone I've had for it, below the local rising trend line. Let's see how low it goes as anywhere within the box is what I've expected.

$ICP price has now wicked into my target area. $2.50 would be the logical, psychological price target within the box if it continues to correct.

Since price has now pushed slightly below the .5 fib level for algorand:native, I wanted to make a quick note on the cup-and-handle structure because this is an important part of how I evaluate these patterns.
I’ve always said that, ideally, you do not want to see the handle retrace more than about 50% of the depth of the cup.
On this chart, my Fib is anchored from the cup bottom around $0.076 to the rim/high around $0.140, so the .50 Fib near $0.103 is the actual halfway point of the cup.
That makes this current area very important.
If ALGO holds around the .50 and reverses, the structure remains much cleaner and more textbook.
If price drops toward the .618 around $0.096, I would not say the entire bullish structure is dead, but the traditional cup-and-handle interpretation becomes much weaker because the handle is retracing too deeply.
And if price starts working down toward the .702–.786 area around $0.091–$0.087, I would probably stop calling it a traditional cup-and-handle altogether and reassess the structure.
That’s the distinction I think is important:
A deeper retracement can weaken or invalidate the pattern without necessarily invalidating the larger bullish market structure.
For now, the .50 is the level I’m watching.
#ALGO #Algorand #Crypto #TechnicalAnalysis #CupAndHandle #Fibonacci #MarketStructure #PriceAction #TradingView

Most alts I am tracking have hit or are hitting the target areas I had for them, around the time I had estimated, between yesterday and Sunday. Again, time is incredibly difficult to predict but this has played out pretty well so far.
$BTC has broken the neckline of the small H&S pattern it was in and is currently falling towards my target as well. The 9 Year trend support line is the key support structure. Price could wick below it but how it reacts on a reclaim of that support is what to watch.
My price target has always been somewhere around 78K. Price has dipped to $79,707 so far. Most are calling for 75K or even lower. Price doesn't typically do what the "mob" is calling for so we will see what happens soon!

$LTC has tapped the top of my target zone right where an ascending trend line crosses that point. Is this as low as price goes? Only the crypto Gods know that:)

$BTC has formed a small head and shoulders structure and price has tapped the neckline twice, which happens to also be in confluence with the parallel channel midpoint.
If this executes and a measured move plays out, that takes price to the bottom of the target zone. Time is what what's hard to predict.

The algorand:native price has hit within .003 of the lower portion of my target, on time. Let's see how it plays out from here:)

Nice interview with new $ALGO CEO:
Banks Are Breaking📉Algorand CEO Explains AI Threat youtu.be/qEv5eFf3X3c?is=S_tP… via @YouTube

The final countdown looks like it has begun:)
#Crypto
🤖 Made with AI
$LTC continues to look structurally healthy to me despite the current pullback.
Litecoin had a strong impulsive move from the mid-$40s into the upper-$70s and is now working its way back toward a major prior support/breakout zone around $51–$56.
That’s the area I’m watching closely.
If price reaches that zone and reverses, it would still be forming a higher low on the larger structure.
A deeper pullback does not automatically mean the bullish thesis has failed.
In fact, if Litecoin can use this former resistance area as support and then begin building higher again, that would create a much stronger structural foundation for the next move.
For now, my primary focus remains the $51–$56 higher-low zone.
If buyers step in there and price begins reclaiming structure, I think the larger bullish setup remains very much intact.
#LTC #Litecoin #Crypto #TechnicalAnalysis #MarketStructure #HigherLow #PriceAction #TradingView

$ICP is sitting at a very interesting area on the macro chart.
What I’m watching closely is the midpoint of this multi-year falling wedge.
That dotted line isn’t random. Price has interacted with this internal structure repeatedly over the life of the pattern, which makes the current area much more important than it may appear on a lower timeframe.
Now zoom into the 4H chart and another piece of the setup becomes clear.
ICP is working through a Fibonacci retracement, with the .50 around $2.70 and the .618 around $2.52.
If the macro midpoint holds here and price begins reclaiming short-term structure, we could see the reversal begin from this area.
But even if the midpoint is temporarily lost, that does not create a bearish scenario.
Price could easily continue down into the .618 Fib around $2.52, establish a higher low, and reverse from there.
That area has been part of my target zone from the beginning.
So the setup I’m watching is:
- Macro structure midpoint.
- 4H Fibonacci retracement.
- Possible .618 liquidity sweep/higher low.
Then look for the actual reversal structure.
Sometimes it’s simply where the correction finishes.
#ICP #InternetComputer #Crypto #TechnicalAnalysis #FallingWedge #Fibonacci #MarketStructure #PriceAction #TradingView


algorand:native continues to follow the macro cup-and-handle structure I’ve been tracking.
Price completed the rounded base, broke above the previous wick/high area around $0.103–$0.105, pushed up toward $0.14, and has now worked its way back down into the area where I expected the handle to find support.
This is the zone I’ve been watching.
We now have confluence between:
- The previous breakout area.
- The developing handle support.
- The .50 Fib around $0.103.
Whether price actually tags the .50 remains to be seen.
It may front-run that level and reverse from the current zone, but a wick into the .50 followed by a strong reclaim would actually make the structure look even cleaner to me.
What I want to see next is a higher low form in this area, followed by a break of the descending handle resistance with acceptance.
A reclaim of roughly $0.111 would be constructive.
A move back through the $0.121 area would make the handle resolution much more convincing.
So far, this correction still looks controlled and structurally healthy.
The setup remains intact.
#ALGO #Algorand #Crypto #TechnicalAnalysis #CupAndHandle #Fibonacci #MarketStructure #PriceAction #TradingView


$ZEC is starting to form what looks like a pretty clear bear flag/rising corrective channel on the 2H chart.
The move down into the ~$1,200 area was impulsive.
The bounce since then has been much slower, more overlapping, and contained inside a rising channel.
That’s exactly the kind of structure I watch for when trying to determine whether a rally is corrective rather than the beginning of a new impulsive move higher.
Right now, price is pushing into the upper portion of that channel and into nearby Fib resistance.
If Zcash can break above this structure with real acceptance and then establish a higher low, that would improve the short-term picture.
But if price rejects here and loses the lower rail, the bear flag thesis becomes much stronger.
Until then, I’m treating this as a corrective rally inside the larger bearish structure.
The green candles are there but the confirmation still isn’t.
#ZEC #Zcash #Crypto #TechnicalAnalysis #BearFlag #MarketStructure #PriceAction #Fibonacci #TradingView

$BTC dominance just hit the upper rail of the symmetrical triangle structure within the macro, ascending parallel structure. I would anticipate a possible path that looks something like this as I don't think it will be ready to leave that structure on a push down to the lower rail quite yet.
If this doesn't happen, and price breaks up, you will see Bitcoin run up stronger than alts, although alts will still follow.
This could eventually play out as a new high for Bitcoin before the end of the year and then a correction. Alts typically go into an altseason after Bitcoin has made a new high and goes into a correction. Alts keep running while Bitcoin is correcting as $BTC profits roll into alts.
If the dominance breaks the lower rail and falls out of the macro structure as well, we could see an earlier altseason than normal. There are always several options to consider:)


To isolate what type of corrective structure $BTC, or any asset might be forming, always go to the lower time frames to see the details you won't see on higher time frames.
This is a rising, parallel channel after a downtrend on the 15M chart. This is typically a bearish structure (bear flag) so I would anticipate price to break downwards after it has consolidated long enough within the structure.
