

Macro research for investors. Covering Asia, commodities, currencies, and asset allocation. Sign up for free daily Newsletter: https://teapawt.net/t.co/C4EG0o3TVg
Joined March 2024
- Tweets1.3K
- Following162
- Followers1.9K
- Likes108




CHINA’S EXPORT ECONOMY IS SPLITTING INTO TWO VERY DIFFERENT WORLDS.
October 2026 reveals an extraordinary divergence between AI-related manufacturing and traditional export industries.
China’s exports of automatic data-processing equipment accelerated from approximately 94% to 116% YoY.
Integrated circuits surged nearly 138%, maintaining exceptional growth.
General machinery strengthened from roughly 15% to 35%.
Meanwhile, automobile export growth slowed from approximately 63% to 37%. Toys decelerated from 42% to 27%, and home appliances weakened from 31% to 20%.
Furniture growth nearly halved, falling from 22% to 12%.
YCC Capital sees a concentrated technology-driven export cycle rather than a broad manufacturing renaissance.
China participates heavily in global AI supply chains, but advanced semiconductor intellectual property and high-margin computing platforms remain dominated by international competitors.
China is capturing AI-related manufacturing volume—not necessarily the industry’s most valuable profits.

1
CHINA’S TRADE BOOM JUST REVEALED A MAJOR STRUCTURAL IMBALANCE.
October 2026 delivered explosive headline numbers:
China’s exports surged 35.2% YoY to $412.33 billion, while imports jumped 41.6% to $307.05 billion.
Total merchandise trade reached $719.38 billion, expanding 37.9%.
But the divergence is revealing.
Export growth moderated slightly from September, while import growth accelerated sharply, surpassing exports by 6.4 percentage points.
YCC Capital believes the import acceleration reflects concentrated demand for AI infrastructure, semiconductors, industrial machinery, and energy inputs—not necessarily a broad recovery in Chinese household consumption.
That distinction changes the investment narrative.
Global AI capital expenditure is supporting China’s industrial activity, but external technology cycles remain volatile.
China’s trade numbers are booming. Its domestic economic foundations remain dangerously dependent on forces beyond Beijing’s control.

1
90
CHINA’S EXPORT SURGE IS HIDING A DANGEROUS DEPENDENCY ON GLOBAL DEMAND.
China’s October 2026 export growth remained extraordinary, but momentum weakened across key destinations.
Exports to the United States grew approximately 32% YoY, down from nearly 39% in September. ASEAN growth moderated from roughly 52% to 45%, while the EU slowed to approximately 23%.
Japan remained near 14%, and Hong Kong eased toward 47% after previously exceeding 60%.
The message is clear: China’s export engine remains powerful, but its acceleration is increasingly fragile.
YCC Capital sees a structural vulnerability beneath these numbers.
China’s manufacturing sector is benefiting from overseas demand while domestic consumption, property markets, and private-sector confidence remain weak.
For global investors, this divergence matters enormously.
China is exporting its way around domestic weakness—not solving it.

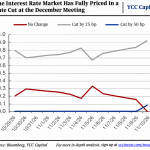
Wall Street Is Pricing a December Fed Cut Despite Persistent Inflation
U.S. interest-rate markets have moved aggressively toward expecting monetary easing at the December Federal Reserve meeting.
As of November 10, the probability of a 25-basis-point cut had climbed above 90%, compared with approximately 70% in late October.
Meanwhile, the probability of no change collapsed from nearly 30% to effectively zero.
A 50-basis-point cut carries a much smaller probability, around 8%.
YCC Capital sees a potentially dangerous disconnect between market expectations and underlying inflation fundamentals.
October headline CPI accelerated to 4.0% annually, while core CPI increased to 2.8%.
Monthly core inflation also exceeded expectations at 0.30%.
With inflation pressures persisting across housing, transportation, and selected consumer goods, aggressive easing expectations may prove vulnerable.
The biggest risk for U.S. bonds is no longer simply inflation. It is the possibility that markets have priced a more dovish Federal Reserve than economic conditions justify.

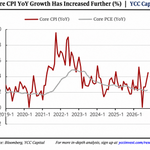
America’s Core Inflation Is Reaccelerating Despite Cooling Energy Momentum
U.S. underlying inflation is proving considerably more persistent than headline disinflation narratives suggest.
Core CPI accelerated to approximately 2.8% annually in October, compared with 2.6% previously.
Meanwhile, the chart’s core PCE series remains near 2.1%–2.2%, highlighting the different signals coming from the Federal Reserve’s two major underlying inflation measures.
The historical contrast is striking.
Core CPI previously approached 9.5% during the 2021–2022 inflation shock before moderating sharply.
Yet the latest readings demonstrate that underlying price pressures have not disappeared.
Monthly core CPI increased 0.30%, exceeding the 0.20% consensus expectation.
YCC Capital believes this creates a difficult policy environment: energy disinflation may eventually lower headline CPI, but domestic services and goods inflation could remain stubborn.
For Treasury investors, persistent core inflation raises the risk that restrictive Federal Reserve policy lasts longer than markets anticipate.

2
190
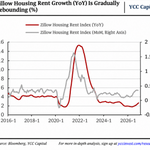
America’s Rental Market Is Quietly Reaccelerating
The U.S. rental market is showing early signs of renewed momentum after several years of disinflation.
Zillow annual rental inflation has recovered toward 2.7%, compared with approximately 2.0% earlier in 2026.
Monthly rental growth has also strengthened toward 0.35%, following a period of substantially weaker readings.
The historical comparison is important.
During the 2021–2022 inflation cycle, Zillow annual rent growth surged above 15%, while monthly increases briefly exceeded 1.5%.
Current readings remain far below those extremes, but the direction has changed.
YCC Capital sees this as an emerging risk to the Federal Reserve’s inflation outlook.
Rental inflation feeds into official shelter CPI with a delay, meaning today’s private-market developments can influence future inflation readings.
The danger is not another 2022-style rental explosion. It is persistent housing inflation preventing the final stage of U.S. disinflation.

1
1
169
America’s Rental Inflation Is Rebuilding Its Momentum
U.S. housing inflation may be approaching another turning point, and private rental indicators are sending an important warning.
Official housing-rent CPI remains elevated near 3.4% annually, despite the dramatic normalization in private-market rents.
Zillow rental inflation previously surged above 15% in 2022, while Apartment List rent growth approached 18%.
Both subsequently cooled sharply.
However, Zillow annual rent inflation has now recovered to approximately 2.7%, compared with 2.49% previously.
Apartment List annual growth has also turned positive at 0.07%, its first positive reading since May 2023.
YCC Capital believes the key risk is the delayed transmission of private-market rents into official CPI.
Housing inflation typically adjusts slowly, making renewed rental strength particularly important for monetary policy.
Even if energy inflation retreats, sticky U.S. shelter costs could prevent core inflation from normalizing as quickly as markets expect.

4
381
China’s Consumer Goods Inflation Reveals a Deeply Uneven Recovery
China’s consumer-price landscape is becoming increasingly fragmented, with sharp differences across discretionary goods and services.
The latest figures show overall monthly growth of approximately 0.74%, compared with 0.16% previously.
Yet several categories remain under significant pressure.
Medical care prices declined 1.46% month over month and 3.31% annually. Cultural and entertainment prices fell 3.27% monthly and 2.85% annually.
Other goods and services, meanwhile, increased 3.57% monthly despite remaining down 4.65% annually.
Household goods rose 1.12% monthly but declined 1.31% year over year.
YCC Capital interprets these divergences as evidence of unstable pricing conditions rather than a synchronized Chinese consumption recovery.
Temporary category-specific rebounds cannot offset persistent weakness across major consumer segments.
For investors, China’s consumer economy remains a highly uneven market where selective price increases coexist with substantial deflationary pressure.

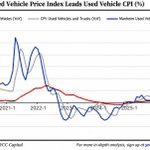
America’s Used-Car Inflation Is Reaccelerating Beneath the Surface
The U.S. used-vehicle market is showing renewed pricing pressure, and the leading indicators deserve attention.
The Manheim Used Vehicle Price Index has recovered from annual declines approaching 15% during 2023–2024 to modest positive growth in 2026.
That is a meaningful reversal.
During the previous inflation cycle, Manheim prices surged more than 50% annually before official used-vehicle CPI followed with increases exceeding 40%.
The relationship matters because wholesale vehicle prices often move ahead of consumer inflation.
Today, official used-vehicle CPI remains near or slightly below zero, even as wholesale pricing has returned to positive territory.
YCC Capital believes this divergence creates upside risk for future U.S. vehicle inflation.
Combined with potential automobile tariffs, stronger wholesale prices could complicate the Federal Reserve’s disinflation outlook.
The next inflation surprise may emerge from categories investors currently consider contained.

America’s Strategic Oil Reserve Is Approaching a Dangerous Threshold
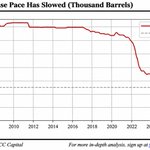
America’s strategic petroleum reserves have undergone an extraordinary structural decline.
U.S. Strategic Petroleum Reserve inventories stood above 700 million barrels around 2008–2011.
By 2023, holdings had collapsed toward 350 million barrels, before recovering to approximately 420 million barrels by early 2026.
The latest drawdown has pushed inventories toward 290 million barrels.
That represents a decline of nearly 60% from historical highs.
More importantly, inventories are approaching the chart’s indicated 250-million-barrel release threshold.
YCC Capital sees this as a growing constraint on Washington’s ability to suppress future oil-price shocks through emergency inventory releases.
Although the recent moderation in crude prices may reduce immediate inflation pressure, depleted reserves leave the United States more exposed to renewed geopolitical disruption.
America may be approaching a point where strategic oil inventories provide substantially less protection against another energy crisis.

1
217
The Collapse in the Brent–WTI Spread Signals a Major Oil-Market Shift
One of the most dramatic developments in global energy markets is the collapse in the Brent–WTI crude oil spread.
The differential surged above $35 per barrel during October 2026, compared with approximately $3–$8 through much of late 2025 and early 2026.
By November, that premium had collapsed toward $1 per barrel.
That represents a decline exceeding 95% from the peak.
YCC Capital interprets this reversal as evidence that the extraordinary geopolitical premium embedded in international crude pricing has rapidly unwound.
For the United States, narrowing global oil-price differentials could reduce imported energy inflation and improve the outlook for transportation costs.
For oil producers, however, the abrupt compression highlights significant volatility in regional pricing relationships.
The market is rapidly repricing geopolitical oil risk, potentially creating one of the strongest disinflationary catalysts heading into 2027.

America’s Oil Shock Is Becoming an Inflation Shock
U.S. energy inflation is increasingly tied to the resurgence in crude oil prices, and the relationship is becoming impossible for investors to ignore.
WTI crude averaged approximately $97.30 per barrel in September before climbing to $102.10 in October, a 4.9% increase.
Meanwhile, U.S. energy CPI reached approximately 340 on the chart’s index scale, compared with roughly 270–290 through much of 2024–2025.
Annual energy inflation accelerated to 20.8%, although monthly growth slowed sharply from 5.2% to 0.7%.
That distinction is critical.
YCC Capital believes the U.S. is experiencing a significant energy-price shock, but the deceleration in monthly inflation suggests the most aggressive phase may be fading.
With WTI subsequently retreating toward $90, energy could become a powerful disinflationary force in 2027.
Oil prices now represent one of the most important variables for Federal Reserve policy and Treasury yields.

6
448
China’s Food Inflation Is Rising While Household Demand Remains Vulnerable
China’s food inflation has climbed back toward 3% annually, creating another potential obstacle for household consumption.
The historical comparison is revealing.
Food inflation surged above 11% in 2022 before collapsing toward 2% during 2024. Since then, annual inflation has gradually recovered toward 3%, while monthly food-price increases have generally remained below 1%.
The three-month monthly measure has also moderated sharply from its previous peak above 3%.
YCC Capital sees a troubling divergence: food prices are rising, but the broader Chinese consumption environment remains structurally fragile.
Unlike discretionary purchases, food expenditures cannot easily be postponed.
Higher grocery bills therefore reduce the income available for electronics, automobiles, travel, and other consumption categories.
For global markets, this creates additional uncertainty around Chinese consumer demand and agricultural imports.
China’s food inflation recovery could pressure consumption rather than stimulate economic growth.

China’s 4% Inflation Rebound Masks a Deeper Structural Problem
China’s headline inflation has rebounded toward 4.0% year over year, but the underlying picture is far less encouraging.
Headline CPI previously peaked near 9% in 2022 before collapsing toward 2.5% during 2024–2025. The latest recovery has lifted headline inflation above core CPI, which remains around 2.5%–3.0%.
That divergence matters.
When headline inflation accelerates faster than underlying prices, the increase may reflect volatile components rather than broad-based household spending strength.
YCC Capital interprets China’s inflation rebound as a potential margin squeeze rather than evidence of economic normalization.
Higher living costs can weaken real purchasing power when wages, employment confidence, and property wealth remain under pressure.
For investors, China’s inflation recovery therefore creates an uncomfortable combination: rising consumer costs without convincing evidence of stronger domestic demand.
Higher inflation does not automatically mean a healthier Chinese economy.

China’s Monthly Inflation Slowdown Exposes Fragile Domestic Demand
China’s inflation recovery is losing momentum, and the latest monthly CPI figures reveal just how fragile domestic pricing power remains.
Headline CPI increased approximately 0.3% month over month, while core CPI advanced around 0.3%, far below the extreme volatility experienced during 2021–2022.
The contrast is striking. Monthly headline inflation previously surged above 1.2%, yet recent readings have largely fluctuated between 0% and 0.5%, including another sharp negative episode approaching -0.4%.
YCC Capital sees this as evidence that China’s inflation remains unstable rather than sustainably demand-driven.
Weak household confidence, property-sector stress, and intense corporate competition continue restricting businesses’ ability to raise prices consistently.
For global investors, the implication is significant: China’s modest inflation rebounds should not be mistaken for a durable consumption recovery.
China’s fundamental problem remains insufficient domestic demand, not insufficient monetary stimulus.

CHINA’S AI IMPORTS ARE EXPLODING—EXPOSING THE HIDDEN COST OF ITS TECHNOLOGY BOOM.
China’s imports of automatic data-processing equipment and components surged 126.2% YoY through October 2026.
Integrated circuit imports increased 58%, while high-technology product imports climbed 44.4%.
Electromechanical product imports advanced approximately 35%, reflecting sustained demand across technology supply chains.
But traditional industries tell a different story.
Aircraft imports fell approximately 36%, automotive chassis and components declined roughly 22%, and auto parts remained in contraction.
The contrast is extraordinary.
China is importing increasingly expensive technology components while several conventional industrial categories remain weak.
Imports from South Korea also accelerated to 79.1%, highlighting China’s reliance on international semiconductor supply chains.
YCC Capital sees this as a structural vulnerability, not evidence of technological independence.
China’s AI export boom depends heavily on imported technology—and that dependence threatens margins, resilience, and long-term competitiveness.

CHINA’S ENERGY IMPORTS ARE RECOVERING—BUT THE INDUSTRIAL DATA TELL A MUCH WEAKER STORY.
China’s cumulative coal and lignite imports increased approximately 22% YoY through October 2026.
Iron ore and concentrate imports rose roughly 24%, while unwrought copper and related materials climbed around 26%.
Textile-related imports also advanced approximately 18%.
Yet the weakness elsewhere is difficult to ignore.
Crude oil imports remained negative at roughly -6%, natural gas imports declined approximately 3%, and unwrought steel imports contracted around 5%.
Natural and synthetic rubber imports fell approximately 15%, while several agricultural categories recorded only modest growth.
This is not the import profile of a synchronized industrial recovery.
YCC Capital sees a fragmented economy where selective commodity demand and price effects coexist with persistent weakness across downstream manufacturing.
China’s import rebound remains uneven, offering little confirmation of a broad domestic economic revival.

CHINA’S IMPORT GROWTH IS ACCELERATING—BUT THE SIGNAL IS MORE INFLATIONARY THAN BULLISH.
China’s October imports surged 41.6% YoY, accelerating from 31% in September and significantly exceeding the 30.36% market expectation.
The chart reveals a simultaneous acceleration in commodity prices and monthly import values.
The RJ/CRB Commodity Price Index has rebounded toward 38% YoY, while monthly import growth has climbed above 40%.
This represents a dramatic reversal from the negative readings observed during 2023–2025.
But rising import values do not necessarily indicate stronger physical demand.
Higher commodity prices can inflate trade statistics even when underlying consumption remains subdued.
YCC Capital believes China is increasingly exposed to imported inflation without experiencing a comparable domestic demand recovery.
The danger is straightforward: higher input costs, weaker industrial margins, and an increasingly fragile trade surplus.

CHINA’S IMPORT PRICES ARE RISING TWICE AS FAST AS EXPORT PRICES—A MAJOR WARNING FOR PROFITS.
By September 2026, China’s import price index had climbed toward 129, compared with approximately 115 for export prices.
That implies import prices were roughly 29% above their year-earlier level, while export prices were only about 15% higher.
The gap has widened to approximately 14 index points.
Earlier in 2026, both indices were much closer to 100.
This deterioration represents a serious terms-of-trade challenge.
Chinese manufacturers are paying substantially more for imported inputs without achieving equivalent pricing gains on finished exports.
YCC Capital believes the result could be accelerating margin compression across export-oriented industries.
Strong nominal trade growth may therefore conceal deteriorating profitability.
China’s exporters are generating more revenue, but rising input costs threaten how much of that revenue they actually retain.

CHINA’S EXPORT BOOM IS BECOMING DANGEROUSLY CONCENTRATED IN AI.
China’s integrated circuit exports surged 111.1% YoY through October 2026, while automatic data-processing equipment exports accelerated to 60.6%.
High-technology exports increased 47.8%, far exceeding the performance of several traditional industries.
Automobile and chassis exports remained strong at 52.2%, but growth slowed from 54.3%.
Meanwhile, fertilizer exports remained deeply negative, approximately -30%, and household ceramics continued contracting by roughly 25%.
The divergence is striking.
China’s strongest export categories are increasingly tied to global technology investment and semiconductor pricing rather than broad domestic industrial strength.
YCC Capital believes this concentration creates significant cyclical vulnerability.
If global AI capital expenditure moderates or semiconductor prices normalize, China’s headline export growth could decelerate rapidly.
A technology-driven export boom cannot conceal structural weakness across the wider manufacturing economy.
