ZoomCharts (@ZoomCharts) header
ZoomCharts (@ZoomCharts) profile picture

Drill Down Visuals for #PowerBI and JavaScript Charts Library for #DataExploration

Europe
Joined February 2014
Photo by ZoomCharts (@ZoomCharts)Photo by ZoomCharts (@ZoomCharts)Photo by ZoomCharts (@ZoomCharts)Photo by ZoomCharts (@ZoomCharts)Photo by ZoomCharts (@ZoomCharts)Photo by ZoomCharts (@ZoomCharts)Photo by ZoomCharts (@ZoomCharts)Photo by ZoomCharts (@ZoomCharts)Photo by ZoomCharts (@ZoomCharts)Photo by ZoomCharts (@ZoomCharts)
Analyzing e-commerce sales data? Which products drive profit? Are discounts hurting margins? Where is revenue being lost? Explore 8 Power BI e-commerce sales dashboards designed to help you make better business decisions. 🔗 zoomcharts.com/en/microsoft-…
1
73
Two Power BI challenges are open: AI Agents & Customer Support — deadline Nov 16 Recruitment Dashboard — deadline Nov 25 Choose your challenge and show what you can create with Power BI: zoomcharts.com/en/microsoft-… #PowerBI #DataVisualization
1
220
Last Wednesday, our team attended the “Business Digitalization” conference in Latvia. #DataVisualization #Conference
1
4
127
New feature! Long-press a NetChart legend item to instantly isolate it and focus on what matters. Long-press it again to restore the full group. No need to hide other items one by one just to focus on the one you need. Learn more: js.zoomcharts.com/whats-new/…
2
1
3
28
ZoomCharts retweeted
Save time building interactive analytics for your product. Our team designs and integrates ZoomCharts JS dashboards, maps, and network explorers around your data. You get the source code and a clear handover. Explore our development services: js.zoomcharts.com/services/z…
1
3
21
Drill Down Scatter PRO and Drill Down Bubble PRO can now calculate and display separate regression lines for legend groups in addition to an overall regression line. Try out Bubble PRO in Power BI: marketplace.microsoft.com/ro…
2
65
Our unique Donut visual for Power BI now supports a dedicated legend for change indicators. Change indicators provide context by showing how a category’s value compares with its reference value. Try Drill Down Donut PRO: marketplace.microsoft.com/en…
2
50
In our Graph visual for Power BI you can hide several selected nodes in one action. Now you can select several nodes and hide them together. Try out Drill Down Graph PRO: marketplace.microsoft.com/en… #PowerBIVisuals
3
65
ZoomCharts visuals update: Series Labels - make line and area charts easier to read. This is useful when several lines are close together. Instead of repeatedly checking the legend and matching colors, report users can see the series name next to the data itself. #PowerBIUpdate
2
45
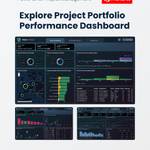
Creative Power BI dashboards for PMO portfolio analytics. Explore all submissions to the FP20 Analytics & ZoomCharts Challenge 41 👇 zoomcharts.com/en/microsoft-…
3
399
Use these Power BI examples to find dashboard design ideas, compare industry-specific KPIs, and see how drill-down charts help turn an overview into practical analysis: zoomcharts.com/en/microsoft-…
2
289
Free Power BI Workshop is LIVE now: youtube.com/live/8hA-qkVESh8… 'How to Build a Software Delivery Dashboard in Power BI'
1
1
2
331
Building an HR dashboard in Power BI? We’ve gathered 10 real Power BI dashboard examples that tackle key HR questions, from workforce planning and attrition to recruitment, compensation, performance, and workload. zoomcharts.com/en/microsoft-…
3
314