

Crypto Trader since 2020 | Daily $BTC Analysis and Trade Ideas | NFA DYOR | Trader at: @vantagetradingac 👀 DM for discord access
In the trenches
Joined February 2025
- Tweets3.7K
- Following41
- Followers6.3K
- Likes2.4K




$BTC
Further upside is just a matter of time.
Although there is still one significant cluster of long liquidations left between $79k and $77k, I don’t think it necessarily has to get taken out.
However, if we do get a sweep into that region, I will use that chance to increase my spot position and add further to my already running swing long trade.
I believe this area will most likely offer the best buying opportunity we get for the rest of this cycle, so make sure to take advantage of it.

$BTC
The stage is set for the next leg up.
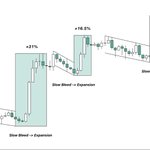
Ahead of the last two FOMC meetings, we had an extended period of slow bleed followed by a major expansion to the upside.
Over the past three weeks, price has once again been slowly grinding lower from $87k all the way down to $79k.
The setup is starting to look very similar.
If history repeats itself and FOMC once again acts as the catalyst, this could be the move that finally sends BTC out of this range and starts the next major expansion higher.

$BTC
No real signs of weakness yet.
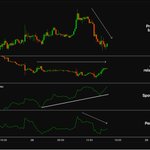
Price is currently pulling back sharply despite some strong spot demand.
Meanwhile, open interest remains relatively flat while futures CVD has started declining.
This suggests that most of the current selling pressure is coming from perps while spot continues to accumulate throughout this move.
As long as spot demand stays intact, I wouldn’t be too concerned about this pullback just yet.
However, spot demand needs to stay intact or else downside momentum could quickly accelerate and turn this into a cascade lower.

$BTC
The scenario I talked about yesterday is now coming into play.
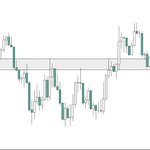
Price has swept the local highs around $81k and is currently trading slightly above our key resistance zone.
For bullish continuation, I want to see buyers hold price above $81.3k into the upcoming 4H close.
In that case, we could see a push towards our short term liquidity target around $82k.
If sellers, on the other hand, step back in and BTC fails to close above the grey zone, there’s a decent chance that the downtrend continues and we target the unswept lows around $79k next.

$BTC
I just don’t get it.
Price is down roughly 10% from the local top and current levels already offer a great buying opportunity.
And yet people are still fixated on getting a 3-5% better entry.
Instead of using this chance to build their position and scale further into it if price continues lower, they risk staying
sidelined because they’re trying to snipe the exact local bottom.
Personally, I would never take that kind of risk, considering that a year or two from now, when BTC is trading at a new ATH, nobody is going to care whether you bought at $80k or $75k.

$BTC
Looks like there is some strong buying interest between $78k and $72k.
On the upside, however, asks remain basically nonexistent.
This is exactly the kind of combination you want to see. Buyers who are willing to step in on any dip while selling pressure is relatively weak in comparison.
I still believe that overall, further upside is favored and that we will soon see the next leg up, whether there is another small pullback first or not.

$BTC
Don’t get baited into a false breakout here.
Price is currently grinding its way back up towards our key resistance level around $81k.
However, with FOMC tomorrow, I wouldn’t expect a breakout just yet.
Price often remains choppy ahead of major events like this and hunts liquidity on both sides while the larger move tends to happen afterwards.
That’s why I could see BTC sweeping the local highs around $81k before rejecting from this area once again and targeting the unswept lows around $79k next.

$BTC
Short squeeze incoming.
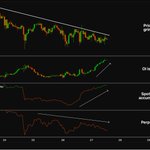
Price is slowly grinding lower while spot has started accumulating again.
Open interest, on the other hand, is building back up while futures CVD continues moving lower.
This suggests that despite some decent spot demand, perps are currently pushing price lower.
We saw a very similar pattern right before price pumped towards $85k last week and shorts ended up getting rekt.
If spot demand stays intact, we could see something similar happen soon.

This is probably one of the most interesting charts right now.
USDT.D is currently sitting at a key monthly support level, and considering that it tends to move inversely to $BTC,
what happens here could be crucial for the upcoming months.
If this support continues to hold and USDT.D bounces again, BTC could see a significantly deeper pullback than most people are currently expecting.
We saw something similar during the previous cycle, where BTC broke out of its bottoming range before pulling back sharply to retest the previous ATH and only then continuing higher.
A similar retest this time around would put BTC back near the $69k region.
That’s a scenario I wouldn’t rule out as long as USDT.D continues to hold this support.
If USDT.D loses this level instead, that would be an extremely bullish development for BTC and could set the stage for the parabolic phase everyone has been waiting for.

$BTC
Things are not looking too bullish.
BTC remains below a key resistance level with a few unswept lows still sitting below price.
From here, I could see one more push towards $81k to sweep the local highs before reversing and targeting those lows next.
As long as $81k remains resistance, I would favor this scenario and potentially even further downside afterwards.
A reclaim of $81k would shift my short term outlook and open the door for a move towards $82k, followed by $82.9k-$83.5k if momentum continues.

$BTC
Price is currently trading between two large liquidity clusters.
The one on the downside sits right below the recent lows and will likely get taken out if buyers are unable to reclaim $81k soon.
The one on the upside is noticeably larger and sits right around the $81k-$82k area.
Considering that we often see an inverse move to Sunday’s price action, I would slightly favor a move into the upper
cluster before potentially continuing lower.

$BTC
After a sweep of the pwL buyers stepped in and pushed price back towards $81k.
This area has acted as support throughout the past two weeks and is our key level to watch for now.
If buyers are able to reclaim it a move towards $82.9k becomes possible.
Should BTC on the other hand get rejected here we will likely continue lower and revisit the $77k-$78k region soon.

$BTC
Looking at the weekly timeframe, the story becomes much clearer.
Price first rejected the yearly open region around $87k, leaving behind a few unswept highs.
Since then, price has sold off into the $80k region, where we have found support and seen multiple sweeps of the lows.
For a move back towards those unswept highs, price now needs to reclaim our mid range S/R level at $82.9k-$83.5k.
If, on the other hand, we lose our key support level, a deeper pullback towards the highly anticipated lows around $75k becomes possible.

I am officially swing long on $SOL
My first entry has been triggered and I have additional bids placed at $93.
See you at $250 ⏳

$BTC
Shorts are getting aggressive again.
Over the past two days, open interest has risen significantly while futures CVD has continued to grind lower.
This suggests that fresh shorts have been building into the move.
Just a few days ago, we saw the exact opposite. Longs got too aggressive, ended up getting squeezed and the entire move to the upside was retraced.
If buyers now manage to defend $80k once again, I wouldn’t be surprised to see late shorts getting squeezed next.

$BTC
My timeline is flooded with comments of people who are expecting lower prices.
However, to me it’s pretty simple. $80k remains support until proven otherwise.
You see for some reason people assume that support weakens the more often it gets tested.
But if you take a look at both the bottoming range and the previous range we broke out from you’ll see that there were plenty of retests of the lows before price eventually expanded further to the upside.
Ranges are designed to shake people out before the real move happens and to me it looks like this is exactly what’s
happening right now.
The plan remains the same. Stay patient and keep bidding any sweeps of the lows.

$BTC
Looking at how liquidity is currently distributed, we can see that overall, continuation to the upside is still favored.
However, with roughly $8B in long liquidations sitting between current price and $77k, another sweep of the lows first is still possible.
If we get that sweep, I would strongly suggest bidding it, as it could be your best chance to buy before BTC trades back above $90k.

$BTC
Price has swept the equal lows and bounced from this key LTF support level at $81.5k.
If BTC can now break out of this bull flag, we might see a bullish continuation towards our local resistance at $82.9k
or potentially even a retest of the monthly open at $83.6k.
These are the two areas I’ll be watching for a possible rejection if we break higher.

$BTC
Looks like we’re just going to stay range bound for the rest of the month.
Due to the repeated liquidity hunts on both sides, the market now seems pretty dry on liquidity.
With neither side finding any real acceptance outside the range, there isn’t much left to fuel a sustained move in either direction.
That’s why I expect BTC to consolidate some more and build up fresh liquidity before possibly going for the next decisive move shortly after the monthly open.

$BTC
Both sides continue to get rekt.
Price first swept the liquidity above the previous high, then sold off, and now it looks like longs are next.
Considering that there is still a massive cluster of long liquidations sitting directly below price, I wouldn’t be surprised to see another sweep of the lows before we get a bounce.
