

Trade Name: SBICAP Securities Ltd. Experience the simplicity of investing, powered by SBI's legacy of trust & transparency, designed for every Indian Investor.
Mumbai
Joined March 2022
- Tweets21.8K
- Following7
- Followers17.1K
- Likes125








Your portfolio can drift even when markets are moving in your favour. As some segments grow faster than others, keeping track of that shift matters.
When was the last time you checked how your portfolio's balance had shifted?
Disclaimer: bit.ly/3I3DzpV
#TheMarketTruth #PortfolioDrift #SBISecurities

556

Market Scanner for 18th November
Key Levels for the day!
To access the complete Derivatives Report click here
bit.ly/4t6CXWw
Disclaimer : bit.ly/R_disclaimer02

2
647
🔔 𝐍𝐚𝐯𝐢𝐠𝐚𝐭𝐢𝐧𝐠 𝐭𝐡𝐞 𝐎𝐩𝐞𝐧𝐢𝐧𝐠 𝐁𝐞𝐥𝐥 : 𝟓 𝐊𝐞𝐲 𝐓𝐞𝐜𝐡𝐧𝐢𝐜𝐚𝐥 𝐈𝐧𝐬𝐢𝐠𝐡𝐭𝐬 📷
Disclaimer: bit.ly/R_disclaimer02
Source: SBI Securities Research

Sectoral Sentiment Quilt 🔑
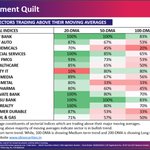
🔸 Technically, Realty, FMCG, Bank Nifty, Private Bank, Infrastructure, PSU Bank, Oil & Gas, Capital Markets, Financial Services and Media sectors are likely to continue their outperformance in the short term.
🔸 On the other hand, Metal, Auto, Defence, Energy, Chemicals, PSE, IT and CPSE sectors can underperform in the short term.
Disclaimer: bit.ly/R_disclaimer02
Source: SBI Securities Research

1
1
116
FII/DII Fund Flow 💹 and Advance Decline Trend📊
🔸 In the cash segment, both FIIs and DIIs were net buyers yesterday to the tune of 4195.38 cr. and 196.93 cr. respectively.
🔸 Meanwhile, the FII long-short ratio for index futures is at 33.41% as on a net basis, they sold 8436 index futures.
Disclaimer: bit.ly/R_disclaimer02
Source: SBI Securities Research

99
Key Index Levels at a Glance!
Track the 20, 50, 100 & 200-day SMAs of key indices.
Stay aligned with the trend. 📈📉
Disclaimer: bit.ly/R_disclaimer02

FIIs were net buyers in the cash market yesterday, buying equities worth ₹4,195 crore. DIIs also bought a modest ₹197 crore.
The bigger story is in the derivatives market as the FII long-short ratio in index futures jumped to 33.4% on November 17, up from 10.6% on November 2. Late last week, it had touched 37% on November 12, the highest reading since June 2025. For most of the past year the ratio was stuck in single digits to low teens. The12-month average about 13% and the low 7.5%. This is a clear break from a long phase of heavy bearish positioning.
FIIs have done large-scale short covering in index futures since the start of November. Their short open interest fell from about 2.64 lakh contracts on November 2 to about 1.18 lakh by November 16, a drop of roughly 55%. Long positions doubled over the same period, from thirty one thousand to sixty five thousand contracts. However, there is one small caveat. Yesterday, FIIs added about 13k fresh shorts against only about 4.5k new longs, so the ratio slipped a little from 34.1%. Although a single day doesn't change the trend, but it is worth watching.
Price action shows that Nifty rallied 8.6% in the week to November 6. It then spent the next week consolidating as investors took a breather, but still closed 0.46% higher. That made it three weekly gains in a row. This week has started firmly, with Nifty at 25,387, up 0.97% week-to-date. It hit an intraday high of 25,501 yesterday and closed at a fresh 26-week high.
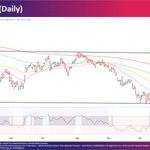
From a technical view, momentum is still firmly positive despite the recent pause. The daily RSI is at about 77.5 and has stayed above 75 for most of the last nine sessions. That shows sustained bullish momentum and supports the uptrend. RSI is in overbought territory, but strong trends can stay overbought for a long time, especially while FIIs keep covering shorts. Dips toward 25050–25150, last week's consolidation zone, could find buyer interest. A clean move above 25,500 would open up the next leg higher.
Going ahead, the 25230-25200 zone is expected to provide strong support to the index. On the upside, the 25470-25500 zone will act as an immediate hurdle. A decisive move above 25500 could trigger a fresh leg of the rally, paving the way for an advance towards the 25650 mark in the near term.
Disclaimer : bit.ly/R_disclaimer02

Summary of Market Participants Positioning in the Derivative Segment for 17th November, 2026.
Synopsis:
In the cash segment, Both FIIs and DIIs were net buyers yesterday to the tune of 4195.38 cr. and 196.93 cr. respectively.
FIIs' Long short ratio for index futures is at 33.41% as on a net basis, they sold 8436 index futures.
On the stock futures front, FIIs have bought to the tune of 6359 contracts, while on the Options Front, FIIs bought 69819 call contracts and bought 66399 Put Option contracts.
Disclaimer : bit.ly/R_disclaimer02


Save the fortune-telling for horoscopes, not price targets.🔮
Disclaimer: bit.ly/3I3DzpV
#StockMarket #StayDisciplined #SBISecurities

630
🔔 𝐍𝐚𝐯𝐢𝐠𝐚𝐭𝐢𝐧𝐠 𝐭𝐡𝐞 𝐎𝐩𝐞𝐧𝐢𝐧𝐠 𝐁𝐞𝐥𝐥 : 𝟓 𝐊𝐞𝐲 𝐓𝐞𝐜𝐡𝐧𝐢𝐜𝐚𝐥 𝐈𝐧𝐬𝐢𝐠𝐡𝐭𝐬 📷
Disclaimer: bit.ly/R_disclaimer02
Source: SBI Securities Research

1
1
631
Sectoral Sentiment Quilt 🔑
🔸 Technically, FMCG, Bank Nifty, Private Bank, Infrastructure, PSU Bank, Oil & Gas, Capital Markets, Financial Services and Media sectors can outperform in the short term.
🔸 On the other hand, Metal, Auto, Defence, Energy, Chemicals, PSE, IT, and CPSE sectors can underperform in the short term.
Disclaimer: bit.ly/R_disclaimer02
Source: SBI Securities Research

1
1
114
FII/DII Fund Flow 💹 and Advance Decline Trend📊
🔸 In the cash segment, FIIs bought to the tune of 4864.68 cr. while DIIs sold to the tune of 3519.05 cr.
🔸 Meanwhile, the FIIs' Long short ratio for index futures is at 34.14% as on a net basis, they sold 767 index futures.
Disclaimer: bit.ly/R_disclaimer02
Source: SBI Securities Research

88