

Where structure, liquidity & human error converge. Est. ’16 @AlienTradingLab | Premium Discord ↓
Outlier
Joined March 2022
- Tweets13.6K
- Following51
- Followers22.2K
- Likes21K



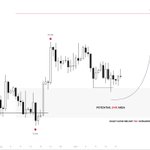



$SOL update: tagged the STH at 125 and rejected. Step one, done.
101-84 can give us the bounce. One more leg down, and the grey zone is where I look for the reversal.
Still not getting ahead of the chart.


$SOL HTF outlook:
A rejection at the STH followed by a rotation back into the grey zone remains my base case.
For bullish continuation, the marked TS low needs to hold. Until the red-marked high is reclaimed, there is no reason to get ahead of the chart.

3 months of +5%: $10,000 becomes $11,576.
Then one loss stings. You size up 5x to win it back. Three trades, three stops.
$9,925.
3 good months. 1 bad afternoon.


Your income doesn't decide when you're free.
Your savings rate does.
Save 10%: free in 33 years.
Save 30%: 20 years.
Save 50%: 13 years.
Spend the raise, keep the job.

not seeing it on Velo yet tbh. spot CVD just made a new low while OI keeps climbing. leg up can still come, I just want spot to confirm it first
true, it's a compounding thing. fixed size and B wins 13k vs 12.4k. trade off is your good months don't compound either

Trader A makes +2% every month.
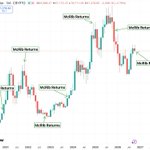
Trader B makes +20%, then −15%, on repeat.
B averages more. A ends the year with $12,682. B with $11,262.
Average returns lie. Smooth beats exciting.


Exactly. Nobody screenshots year 7 of a boring +30%. But that's where the real money quietly shows up.
Appreciate it.🙏
Best time to learn this stuff is early, before the market teaches it the expensive way.
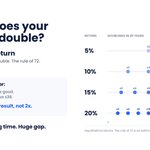
10% a year vs 20% a year.
Sounds like twice as good.
Over 20 years it's x6.7 vs x38. Almost 6x the result.
72 ÷ your yearly return = years to double. Small edge, long time, huge gap.


Higher timeframe: where are we going?
Lower timeframe: how are we getting there?
Most "you were wrong" replies I get are just answers to the wrong question.
