



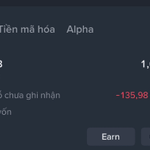


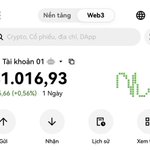

Thị trường càng đỏ, tôi càng khó tìm lý do để đứng ngoài.
Vừa mua thêm một ít cổ phiếu Mỹ.
Không biết đâu là đáy. Ngắn hạn hoàn toàn có thể giảm tiếp, nhưng tôi không tìm thấy cơ hội nào hấp dẫn hơn thời điểm này.
Giá cổ phiếu đang giảm không đồng nghĩa với việc câu chuyện tăng trưởng đã kết thúc.
Tôi không cố bắt đúng đáy. Chỉ chia vốn mua dần khi định giá trở nên hấp dẫn hơn.
Khi đám đông không dám mua, tôi chọn vừa khóc vừa giải ngân.

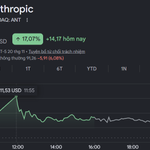
Cổ phiếu Anthropic giờ có vốn hóa gần bằng Bitcoin. Nhưng có phải nhà đầu tư đang bán BTC để mua IPO?
Bitcoin vừa chạm $61.381, thấp nhất kể từ tháng 7. Trong 24 giờ, $528M vị thế đòn bẩy bị thanh lý, hơn 113.000 trader bị ảnh hưởng. 80% là lệnh Long.
Có 3 nghi phạm:
1. Fed
Dữ liệu lạm phát nóng khiến xác suất Fed tăng lãi suất ngày 9/12 vượt 80%. Lãi suất cao gây áp lực lên tài sản rủi ro.
2. Bitcoin ETF
ETF Bitcoin giao ngay tại Mỹ ghi nhận 7 phiên liên tiếp bị rút vốn. Đây là dòng tiền thực sự đang rời thị trường.
3. Anthropic
IPO với mức định giá khoảng $1.27 nghìn tỷ USD khiến nhiều người đặt câu hỏi: Liệu nhà đầu tư có đang bán BTC để gom tiền mua cổ phiếu ANT?
Nhưng hiện chưa có bằng chứng xác nhận dòng tiền này.
Strategy (MSTR) cũng chịu ảnh hưởng, giảm khoảng 5%. mNAV xuống 0.97x, tức giá trị thị trường của công ty thấp hơn lượng Bitcoin họ đang nắm giữ.
Đừng vội đổ lỗi cho IPO Anthropic.
Hiện tại, Fed và dòng vốn ETF mới là hai nghi phạm có dữ liệu rõ ràng hơn.

4
8
508
Gần 1,7 nghìn tỷ USD bốc hơi chỉ trong 80 phút. Chuyện gì đang xảy ra?
Có 4 yếu tố chính đang gây áp lực lên toàn bộ thị trường:
Fed có thể tăng lãi suất: JPMorgan dự báo 3 lần tăng liên tiếp. Đây là kịch bản không ai muốn thấy trong bối cảnh hiện tại.
Dòng tiền hướng đến IPO Anthropic: Một số nhà đầu tư có thể đang bán tài sản hiện tại để chuẩn bị vốn tham gia thương vụ IPO đang được chú ý.
Căng thẳng Trung Đông: Các cuộc tấn công mới của Houthi làm tăng nguy cơ leo thang xung đột, kéo theo áp lực nguồn cung dầu.
Kỳ vọng chính trị thất bại: Cuộc gặp Trump, Tập Cận Bình và Putin không mang lại tín hiệu tích cực như thị trường mong đợi.
Quan điểm cá nhân:
Đợt bán tháo này có phần quá đà, đặc biệt là với crypto.
Khi tâm lý hoảng loạn lan rộng, những tài sản tốt cũng bị bán bất chấp giá trị thực.
Nếu vùng cầu hiện tại được giữ vững, đây có thể là cơ hội tích lũy đáng chú ý cho chu kỳ vài năm tới.
Thị trường luôn chuyển tiền từ người thiếu kiên nhẫn sang người có kế hoạch.

13
18
899

Ngân hàng trung ương mua 321 tấn vàng, nhưng giá vẫn giảm 36% từ đỉnh.
Vàng vừa xuyên thủng mốc $3.600, có thời điểm chạm $3.549, thấp nhất trong hơn 14 tháng.
Điều đáng chú ý là thị trường đang có hai dòng tiền đối lập:
Phương Tây, đặc biệt các quỹ Mỹ, đang bán tháo.
Châu Á vẫn tích lũy, Trung Quốc tăng mua vàng miếng và xu vàng 7%.
ETF vàng toàn cầu vẫn nắm giữ lượng vàng kỷ lục gần 4.256 tấn.
Ngắn hạn, phe bán đang chiếm ưu thế.
Lấy lại $3.600 mới có tín hiệu suy yếu. Nếu tiếp tục nằm dưới mốc này, áp lực giảm vẫn còn.
Vàng dài hạn có thể hấp dẫn, nhưng đừng nhầm giá giảm với tín hiệu đảo chiều.
Phương Đông có đủ sức hấp thụ lượng vàng mà phương Tây đang xả?

14
13
1,138
Sáng nay nhìn thông báo giá vàng thực sự sốc anh em à!
Mới ngày nào vàng còn trên $5k5 mà giờ đã về tận đầu 3.
Người mua vàng lúc fomo thì phải ôm rất lâu nữa.

11
12
977


I approached @RebateLaunch ’s sniper feature with a question that speed-focused products often avoid: when is waiting the better trade?
What I like:
- The tool is built for new pools opening on Elysium.
- Fast detection can capture opportunities that manual monitoring misses.
- A dedicated workflow may reduce operational hesitation.
What I would verify:
- I have not independently tested transaction ordering, contract filters, or launch-quality screening.
- Early liquidity can be especially fragile.
- The first available price may not be the best price.
My verdict:
Hypesium can improve the timing of a decision. It cannot decide whether the decision deserves to be made.
A disciplined trader should be comfortable not taking a trade when the contract, pool, or distribution is unclear. The best sniper is not the one that enters every launch. It is the one that filters aggressively enough to preserve capital.
#Rebatelaunch #Elysium #Sniping #CryptoTrading #DYOR

each token valued at its all‑time high. The platform has also paid out $28,800 to holders through 126,000 individual payouts. In addition, 39.2 million robinhood:0xb7ff57631b97000d950236ef63bd463da5beba7e tokens were purchased, with the associated fees burned, representing 3.92% of the total supply. Since its launch on October 27, Rebate Pad has facilitated 37 separate token launches, showcasing its rapid growth and the trust of the community.

Three weeks of Rebate Pad, on three chains.
$258K in bonus tokens to buyers, valued at each token's all-time high.
$28.8K paid to holders across 126K payouts.
39.2M $REBATE bought with fees and burned, 3.92% of supply.
37 launches since 27 Oct.
app.rebatepad.dev

Aura ✧ retweeted

Three weeks of Rebate Pad, on three chains.
$258K in bonus tokens to buyers, valued at each token's all-time high.
$28.8K paid to holders across 126K payouts.
39.2M $REBATE bought with fees and burned, 3.92% of supply.
37 launches since 27 Oct.
app.rebatepad.dev
The long-term success of @RebateLaunch will depend on whether its reported activity can become repeatable across new launches, chains and user cohorts.
The platform already highlights several measurable components:
User activity:
• 26,012 buys in a two-week snapshot
• More than 124,000 holder payouts
• 437 payout rounds
• 902 holders in an earlier 14-hour update
Economic activity:
• $254,000 in buyer bonus tokens
• $28,700 paid to holders in a later update
• $455,000 traded in an early snapshot
• 0.7% stated platform fee
Token economics:
• 26.5M or 35.3M robinhood:0xb7ff57631b97000d950236ef63bd463da5beba7e burned in separate public snapshots
• 19.2M burned on Robinhood Chain
• 7.3M burned on Elysium
• 973.45M of 1B supply reported in one update
Supply-side growth:
• 8 community launches in an early update
• RWA pairs linked to PLTR, GOOGL and MSFT
• Multi-chain access across several environments
A repeatable launchpad should be measured across four dimensions:
Acquisition: How many new builders, buyers and holders arrive?
Conversion: How many visitors become buyers or liquidity providers?
Retention: How many return for the next launch?
Value flow: How much reaches holders, burns and the wider platform?
The most important ratio may be repeat activity per participant.
If buyers return, holders remain active, communities launch again and payouts continue across multiple rounds, the platform is building a marketplace rather than a collection of isolated campaigns.
Reported numbers should always be labeled by date, chain, cohort and valuation method.
Rebate Pad has created a strong base of public metrics to monitor.
The next phase is proving durability.
Early numbers attract attention.
Consistent numbers build confidence.
Repeatable numbers define the ecosystem.

The early traction reported by @RebateLaunch becomes more useful when separated into buyers, holders, payouts and community launches.
Public snapshots have referenced several figures:
• 902 holders in an early 14-hour update
• $455,000 traded in that same update
• 8 community launches
• 97M bonus tokens handed out in that early update
• 14 payout rounds in the early snapshot
• 26,012 buys across a later two-week snapshot
• More than 124,000 payouts in a later update
These numbers should not be treated as one single time series unless the timestamps are aligned.
Instead, they can be organized into cohorts:
Early activity cohort:
• 902 holders
• $455,000 traded
• 8 community launches
• 14 payout rounds
Two-week activity cohort:
• 26,012 buys
• $254,000 in bonus tokens
• $28,500 paid to holders
• 120,403 payout events
Later payout cohort:
• More than 124,000 payouts
• $28,700 distributed
• 437 rounds
This format helps prevent a common analytical mistake: adding numbers from different periods as if they were cumulative totals.
The metrics answer different questions.
Holder count measures reach.
Trading volume measures activity.
Buy count measures transaction frequency.
Payout rounds measure operational repetition.
Community launches measure supply-side participation.
The most important next step is publishing consistent timestamps and definitions.
Users should know whether each figure is:
• Daily
• Cumulative
• Snapshot-based
• Chain-specific
• Project-wide
• Valued at market price or token high
Rebate Pad has already shared a wide range of activity metrics.
The next level of transparency is organizing them into a consistent dashboard.
Early traction is encouraging when it is measurable.
Cohort clarity is what makes it comparable.

The burn narrative around @RebateLaunch becomes more useful when every figure is attached to a clear reporting period.
Public updates have referenced multiple supply snapshots, including:
• 26.5M REBATE burned in one update
• 35.3M REBATE burned in a two-week update
• 19.2M burned on Robinhood Chain
• 7.3M burned on Elysium
• 973.45M remaining out of a 1B supply in one reported snapshot
These numbers should not be combined automatically because they may represent different timestamps or reporting states.
A proper supply dashboard should include:
Original supply: 1B REBATE
Burn total: timestamped cumulative figure
Burn by chain: Robinhood Chain vs Elysium
Remaining supply: timestamped current figure
Burn rate: tokens burned per day or per unit of volume
Verification: transaction references
For example, 26.5M burned represents 2.65% of a 1B original supply. A 35.3M figure represents 3.53% of that same original supply.
Those percentages are easy to calculate, but only meaningful if the underlying snapshots are clearly separated.
The economic question is also important.
A burn reduces supply, but demand still depends on platform use, liquidity, community participation and token utility. A lower supply does not guarantee a higher market value.
Rebate Pad connects the burn mechanism to platform fees. Its public materials state that every trade pays a 0.7% platform fee and that activity on Robinhood Chain and Elysium supports robinhood:0xb7ff57631b97000d950236ef63bd463da5beba7e buy-and-burn mechanics.
That creates a measurable operating relationship:
Trading volume → platform fee → buy-and-burn activity → supply reduction
The quality of the model depends on verifiable reporting at each step.
Burns are easy to discuss.
Timestamped proof makes them useful.

Gồng lỗ cả triệu đô mà vẫn ngủ ngon, đúng là đẳng cấp nhà giàu!
Nhiều trader nhìn PnL âm hàng triệu USD mà vẫn bình thản như không có chuyện gì xảy ra.
Còn mình, tài khoản đỏ vài trăm đô đã mất ăn mất ngủ.
Chắc không phải do tâm lý yếu, mà vì số tiền mình dám tưởng tượng còn chưa bằng số lỗ của họ.
Đúng là cùng chơi một thị trường nhưng khác nhau cả một tầng tài sản!

8
7
2,272
The six-chain payment claim highlighted by @RebateLaunch is important because it shifts the question from “Can users access the launch?” to “How efficiently can liquidity move across the launch?”
The public comparison describes Rebate Pad as accepting payments from six chains.
That creates a broader access surface, but access alone is not enough. The quality of the route depends on measurable execution data.
The key metrics are:
• Supported source chains: 6
• Average transaction completion time
• Failed transaction rate
• Bridge or routing cost
• Slippage during execution
• Liquidity depth after purchase
• Number of active buyers per chain
• Volume contribution by chain
A multi-chain launchpad can help projects reach more communities. It can also reduce the need for users to manually move assets before participating.
However, more routes create more complexity.
Users should verify which asset they are paying with, which chain receives the token, whether the transaction uses a bridge or an aggregation route and how fees are displayed before signing.
Rebate Pad’s broader chain footprint includes Robinhood Chain, HyperEVM and Elysium, while its public comparison references payments from six chains.
The ecosystem’s long-term performance should be measured by activity rather than the number of supported networks alone.
A useful dashboard would show:
Chain A: buyers, volume, average trade size
Chain B: buyers, volume, average trade size
Chain C: buyers, volume, average trade size
It should also show whether holders from different chains receive the same payout rules and whether robinhood:0xb7ff57631b97000d950236ef63bd463da5beba7e burn activity is distributed across networks.
Cross-chain access can make a launchpad more inclusive.
But the best result is not simply more chains.
It is smoother execution, deeper liquidity and stronger retention across those chains.
The network map is the beginning.
The flow of real activity is the metric that matters.

103
85
3,643
The RWA expansion highlighted by @RebateLaunch introduces a market-design challenge: users need to understand both the real-world reference and the on-chain token mechanics.
The project has publicly mentioned new RWA pairs on Robinhood Chain linked to:
• PLTR
• GOOGL
• MSFT
It also described a model where buyers receive bonus tokens and holders are paid in the same stock-linked token.
For each RWA pair, users should evaluate at least five data layers:
Reference asset:
• What market does the token track?
• Is pricing continuous or tied to market hours?
Oracle data:
• Which price source is used?
• How frequently is it updated?
• What happens during data outages?
Liquidity:
• What is the pool depth?
• What is the spread?
• How much slippage occurs on a standard trade?
Payouts:
• What percentage is paid to holders?
• How many rounds have been completed?
• What is the payout asset?
Legal and economic rights:
• Does the token represent ownership, exposure or a synthetic reference?
• Are redemption rights defined?
• Who controls the underlying structure?
The attraction of RWA pairs is measurable familiarity. Users understand the names, while the launchpad adds on-chain trading, bonus mechanics and holder participation.
But familiar names do not remove technical or market risk.
A tokenized market should be judged by the quality of its pricing, liquidity, documentation and settlement process.
Rebate Pad’s RWA direction expands the launchpad beyond purely meme or community-native assets.
The opportunity is significant, but the reporting standard must also be higher.
Every pair needs a clear data model.
Every payout needs a clear rule.
Every market needs transparent liquidity.
RWA adoption will depend on understandable numbers, not only recognizable tickers.

The buy-bonus range promoted by @RebateLaunch is one of the clearest numerical features of the Rebate Pad model.
The public launchpad comparison references bonuses between 2% and 9% on buys.
That range should be read as a mechanism, not as guaranteed profit.
A bonus percentage can describe the number of additional tokens allocated relative to a purchase. It does not automatically describe the market value of those tokens after launch.
For example, if a user buys $100 of a token and receives a 5% bonus, the nominal bonus allocation could be equivalent to $5 at the stated calculation point. The realized value may change immediately if the token price moves, liquidity is limited or selling pressure increases.
The key questions are:
• Is the bonus calculated on purchase amount or token quantity?
• At what price is the bonus valued?
• Is the bonus liquid immediately?
• Is there a lockup or vesting period?
• Does the bonus come from supply, treasury or platform allocation?
• Does the bonus differ by project or chain?
Rebate Pad’s broader reported metrics add context:
• $254,000 in bonus tokens reported over a two-week snapshot
• 26,012 buys in the same public snapshot
• More than 124,000 holder payouts in a later update
• $28,700 paid to holders in that later update
These figures suggest that the buyer incentive is part of a larger platform system rather than a single isolated feature.
However, users should separate nominal bonus value from realized value.
A responsible analysis should track:
Bonus tokens issued
Bonus tokens sold
Average time to sell
Price impact after distribution
Bonus value relative to liquidity
Repeat-buyer rate
The 2% to 9% range can be attention-grabbing.
The real question is whether the bonus creates sustainable participation without overwhelming liquidity or confusing users about risk.
Incentives work best when the numbers are clear.

Vàng cũng bắt đầu SALE rồi anh em ơi!
Giá vàng đã rơi xuống dưới $3.900, nhìn chart mà thấy hấp dẫn hơn hẳn.
Mình đang chờ một cú điều chỉnh sâu về vùng $3.200 để gom thêm ít vàng tích trữ.
Không biết cụ có cho cơ hội đó không hay lại quay đầu phi thẳng lên?
Có tiền thì muốn mua lúc giá giảm, nhưng giá giảm thật lại muốn chờ giảm thêm. Đúng là lòng tham không đáy!
