

We're here to show which leader and country is really world-beating in the battle for global power...and why
London, UK
Joined June 2010
- Tweets22.1K
- Following2.6K
- Followers14.6K
- Likes394





Pinned Tweet
Ten years after Brexit, the final whistle has blown.
Did Britain become richer, stronger and more sovereign — or poorer, weaker and less influential?
Brexit at 10 tests the promises against the data.
No slogans. Just the score.
newsletter.leagueofnations.c…

A spending ratio is not a readiness test. Equipment delivered, stocks available and forces ready for their tasks matter more than preserving a budget multiple. Read the League report on what defence spending can—and cannot—tell us.

149
A delayed air-defence or ammunition programme leaves its intended shortage unresolved for longer.
Our report argues for published procurement costs and delivery schedules.
Read the full report on the League of Nations website.

114
Military-spending growth, 2021–2025:
EU27: 76.2%
Russia: 188.9%
These are changes in current US dollars. Inflation and exchange rates affect the comparison.
Read our defence-spending report on the League of Nations website.
227
Before the Halloween headlines give you a fright: spending is not a count of deployable forces.
Equipment, personnel, supplies and readiness need their own evidence.
Read our EU–Russia defence report on the League of Nations website.
194
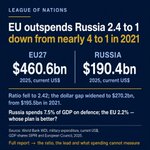
The EU-to-Russia military-spending ratio fell 39% between 2021 and 2025.
The EU’s dollar lead grew from $195.5bn to $270.2bn. Russia grew faster from a smaller base.
Read the full comparison on the League of Nations website.

98
A Halloween disappearing act? The EU’s defence-spending lead hasn’t vanished.
It spent $460.6bn to Russia’s $190.4bn in 2025. The ratio fell, but the dollar lead grew.
Read the figures on the League of Nations website.

125
EU 1 – UK 0 on services-export growth between 2014 and 2025.
Britain: 79.8%. EU27: 86.3%.
Our report proposes an annual review of services trade barriers and progress towards removing them.
Read the full report on the League of Nations website.

88
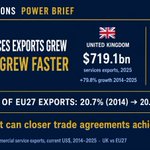
Britain’s services exports were equivalent to 20.7% of the EU27 total in 2014 and 20.0% in 2025.
This compares export totals. It does not measure British firms’ share of the European market.
Read our services-export report on the League of Nations website.
111
The proposed UK–EU agri-food agreement would remove most certificates and checks on the products it covers.
Services exporters face different barriers. Our report argues for a separate programme to address them.
Read it on the League of Nations website.
136
Britain added roughly $319bn in annual services exports between 2014 and 2025.
The EU27 added about $1.67tn from a much larger starting point.
The growth rates: 79.8% and 86.3% respectively.
Read the full comparison on the League of Nations website.

98
Britain’s services exports grew by 79.8% between 2014 and 2025. The EU27’s grew by 86.3%.
UK exports reached $719.1bn. The EU27 total reached $3.60tn.
Read the comparison in our latest services-export report on the League of Nations website.

120
THE SCORECARD IS OUR JUDGEMENT. THE SPENDING FIGURES ARE THE EVIDENCE.
Our Russia–EU brief scores plans, policies and performance. Those ratings are the League's interpretation, not a World Bank finding or a prediction of who would win a war.
Read the argument—and test it—on The League of Nations website.

170
24% COLLABORATIVE PROCUREMENT. A 35% COLLECTIVE BENCHMARK.
That is one concrete test of Europe's defence cooperation, using the EDA's 2025 figure and voluntary benchmark.
Shared orders still have to deliver. Count compatible equipment, dependable supplies and readiness alongside the money.
Read the League's match report on The League of Nations website.
118
EUROPE HAS ECONOMIC WEIGHT. CAN IT TURN IT INTO COLLECTIVE DEFENCE?
The League's answer is to spend together where shared orders, compatible equipment and common support make forces more effective.
The goal is credible capability. The spending share is one warning light.
Read the match report on The League of Nations website.
1
149
A BIGGER SHARE IS NOT A BIGGER ARMY.
GDP shares reveal the burden a country carries. They do not tell us how much usable capability each euro or rouble buys.
The League's match report asks Europe to take the spending gap seriously—and judge its response by delivery.
Read it on The League of Nations website.

151
RUSSIA DEVOTES MORE OF ITS ECONOMY TO THE MILITARY. EUROPE MUST MAKE ITS RESPONSE COUNT.
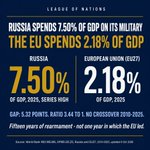
In 2025: Russia 7.50% of GDP; the EU aggregate 2.18%. Across all 16 annual observations from 2010 to 2025, Russia's share was higher.
That is a comparison of economic effort. It does not mean Russia has 3.44 times Europe's military capability.
The League's question: how does Europe turn greater investment into forces that can act together?
Read the full match report on The League of Nations website.

1
149
A FRESH DELAY SHOULD HAVE TO EARN ITS CASE.
What happens to emissions, revenue and household support? Who funds the replacement?
Europe's long-term plan deserves better than another vague promise. Read this week's climate brief in the League newsletter.
149
COUNT THE WORK, NOT THE ANNOUNCEMENTS.
Homes improved. Households reached. Support paid. Energy burdens reduced.
That is the League's proposed scorecard for Europe's extra year before ETS2. Read the full brief in our newsletter.
130
MOSCOW CAN WAIT.
A slower escape from fossil-fuel dependence can favour exporters, including Russia. That is a strategic risk, not evidence that Moscow directed the summit row.
Read the argument in the League newsletter.
154