







ALT National Transportation Atlas Database (NTAD) logo.


ALT Image: Diagram of Traffic Sign Detection and Classification Module

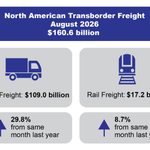
ALT Infographic displaying total North American transborder freight for August 2026, totaling $160.6 billion. The graphic highlights the top two transportation modes: Truck Freight: $109.0 billion, representing a 29.8% increase from the same month last year. Rail Freight: $17.2 billion, representing an 8.7% increase from the same month last year.

ALT The line chart illustrates the number of scheduled flights operated by Marketing Network Carriers and their branded codeshare partners, excluding cancellations, over the two years preceding the latest data release. In August 2024, approximately 647,000 flights were operated, increasing to approximately 659,000 in August 2025, reflecting year-over-year growth.

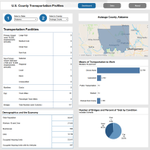
ALT The dashboard features demographic and economic statistics derived from both the 2024 American Community Survey 5-year Estimates and from 2023 County Business Patterns; alongside mapping visualizations and statistical summaries for the selected county as to how many airports, bridges (2025 data), rail lines, and maritime dock facilities (2026 data) are within its boundary.

ALT This map depicts the observed 2025 median travel time of trucks to arrive in a county in the contiguous United States upon leaving Los Angeles County, California. Counties on the west coast have the shortest elapsed travel time from LA County with increasing travel times as distance increases. Counties without interstate access or major population centers tend to have higher elapsed time than neighboring counties with these features.

ALT The figure is a line graph showing the producer price index (PPI) for five freight transportation services compared to all services by month from January 2019 to September 2026. The y-axis shows the index value, not seasonally adjusted, from January 2019. In September 2026, the arrangement of freight and cargo PPI was +3.6%, while truck, air, water, rail, and all (transportation and non-transportation) services were +19.3%, +6.4%, +19.3%, +1.3%, and +6.3%, respectively, from January 2019.

ALT This Summary Infographic shows the Numbers of Employees in the U.S. Airline Industry in August 2026. The infographic contains four boxes. The two boxes on the left show the Numbers of Employees in the U.S. Airline Industry. The two boxes on the right show the percentage change in numbers of employees from the previous month.2 The top boxes show the Total Number of Employees in U.S. Airline Industry in August 2026 is 1,038,900, and 0.1% higher than the previous month.


ALT Image: April 1959 issue of Fly-By, volume 1, number 3.

ALT President Lyndon B. Johnson signing the Department of Transportation Act at a table while officials and attendees stand behind and watch.

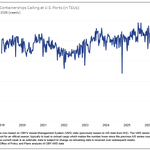
ALT This line chart shows the weekly capacity of containerships calling at U.S. ports over time. The x-axis represents time, from 2019 to present (September 2026) and the y-axis represents capacity ranging from 0 to 2.5 million twenty-foot equivalent units (TEUs). Current capacity is around 2.0 million TEUs.

ALT The figure is a bar chart showing the year-over-year change in the Consumer Price Index (CPI) from September 2025 to September 2026, along with transportation's contribution to the overall change in the CPI by item. The overall CPI rose 3.7% from September 2025 to September 2026; transportation contributed to the growth by 35.4% over the time period. Gasoline (all types) is the first item and contributed 29.5% to the overall growth in the CPI and motor vehicle insurance is the last item contributing -3.7%.

ALT The blue rectangle shows the value of the Freight Transportation Services Index (TSI) in August 2026 (134.4). The grey side-by-side rectangles show the percentage change in the Freight TSI – the left one showing the percentage change from the previous month (-0.4%) with a down arrow and the right one showing the percentage change from the previous year (-3.0%) with a down arrow.

ALT Infographic with a large blue rectangle on top featuring an airplane and text: "July 2026 passenger enplanements domestic & international." Below are two gray rectangles side-by-side: left "79.2 million, not seasonally adjusted," right " ↓ -1.0% from previous month." Bottom two gray rectangles: left " ↓ -1.8% from the same month last year," right " ↑ 4.1% from July 2019."

ALT Transportation Librarians Roundtable logo

ALT Image: FAA World Newsletter from January, 1991

ALT The figure is a line chart showing two lines – one for the price of diesel fuel and one for regular gasoline (all formulations) by month from September 2025 to September 2026. The price for diesel fuel ranges from $3.75 in September 2025 to $6.29 in September 2026. The price for regular gasoline ranges from $3.17 in September 2025 to $4.36 in September 2026.