

Sometimes maybe good, sometimes maybe shit.
Stuttgart, Deutschland
Joined January 2017
- Tweets2.4K
- Following195
- Followers154
- Likes6.3K




Mo retweeted

When $GOLD tops, the stock market rallies. Last time the price of Gold peaked, we went onto a 9 year long bull market that tripled. Gold went on to a 9 year long bear market.


Mo retweeted

Everyone and their mom is planning on selling "the top" next month because they believe the 4 year cycle is still repeating.
As i've been saying since the start of 2025, this will be crypto's first 5 year cycle. The cycle will extend well into 2026 due to things like the SLR adjustments, the credit cycle, and Bessent's mandate from heaven to "run the economy hot."
Past cycles lined up perfectly with YOY liquidity growth and wider macro conditions that were supportive of risk assets. This cycle hasn't had anything even remotely similar. It's been abysmal which is why it's felt miserable for most of the crypto space despite BTC going basically up only due to the ETF bid + institutional narrative.
2026 we have Powell out of office and Trump stacking the Fed in his favor, while asking for 300bps of cuts. We have the Clarity act which on it's own is bullish enough to kick off a bull run, Altcoin ETF's, the SEC throwing the doors wide open and so much more.
Past cycles topped in peak euphoria, with retail mania everywhere, as liquidity shifted from maximum easing toward tightening (taper/QT/hike signaling). Those tops made perfect sense if you looked at them through a macro lens.
This cycle makes zero sense. We are heading into a rate CUTTING cycle. QT isn't getting ramped up but likely ending in early 2026. SLR policy for banks is LOOSENING reserve requirements not tightening.
Coupled with the ramping up of institutional involvement, the regulatory floodgates opening wide and the ETF's acting as the ultimate onramp for boomers trillions (most ETF action is retail driven not institutional) I think it is beyond absurd to think this cycle is anywhere even close to over.
That coupled with the fact that the institutions are onboarding slowly. They're marketing, releasing products, and getting their clients into crypto. We should see this accelerate into 2026 as well.
I'm sure at some point we'll see a crazy sell off driven by the 4 year cycle believers. Don't let them psyop you.
This will be the first 5 year cycle and we're just getting started.


Mo retweeted

Who wants to be approved to stream on @AbstractChain?
I’m accepting applications on stream today.
We’re also scratching @gacha_game_ cards.
I will win the jackpot…
Live now: portal.abs.xyz/stream/Ely







Mo retweeted

Traders' unrealized profit margins are at high levels.
The higher it is, the bigger the probability of a price correction.
Current level is 47%, previous peaks were in March at 69% and 48% in December 2023.


Mo retweeted

Sui is literally exploding right now, shadowing Solana
We didn't lie about the Suinami 🌊
- Current TPS: 756 (Sui) vs 726 (Sol)
- Daily Active Accounts: 1.17M (Sui) vs 2.1M (Sol)
- Daily Transactions: 58M (Sui) vs 35M (Sol)
- Weekly Ethereum outflows: 55M (Sui) vs 69M (Sol)
- Average Fee usd: 0.0018 (Sui) vs 0.0044 (Sol)
- TVL: 1B (Sui) vs 5.5B (Sol)


Mo retweeted

$LINK is one of those opportunities of a lifetime
It’s all or nothing
Either Chainlink becomes key infrastructure for the entire financial system that transacts quadrillions annually, or it totally fails
If it’s successful, it’ll be bigger than you can ever imagine
If it fails, there are future opportunities
Risk-reward is off the charts with $LINK


Mo retweeted
#Crypto total marketcap at resistance. If memes start going crazy up here, I'll start taking profits before the market kills itself from people rotating and market dilution. Right now people are doing well holding so not worried yet but important to pay attention.

Mo retweeted

In this kind of market, don’t buy the impulse.
Wait and buy the first test of the 200EMA on the 5 min.
The next best play is after 4-5 bounces off the 5 min 200EMA, 15 min and hourly 200ema’s usually give really nice trade set ups as well.
Feel free to back check it on this latest move.
This only works for higher volume altcoins that are on multiple exchanges and works well because a lot of algo’s use this strategy for trading bots and so a lot of buying pressure exists around these dynamic supports.
Good luck and have fun. We’re just getting started 🙏🙏
Attached are $SOL and $BTC for examples.


Mo retweeted

$BTC
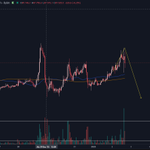
Third test into key S/R. Breakouts typically occur on the 4th test. While I do understand current bullish sentiment to a degree, I cannot ignore key resistance here. Additionally, all local stops are about to be taken. Could see a pullback after sweeping 30.5K.

