

"Let the Chart Speak" #Crypto #Commodity #Equity All my tweets for education & research purpose only Not a Finical Advice
Global
Joined August 2010
- Tweets3.2K
- Following22
- Followers1.7K
- Likes3.2K

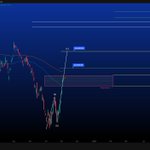
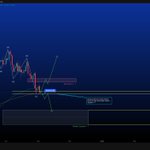
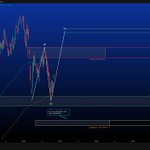


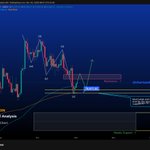


Chart Seekers retweeted
$OIL | $CRUDE | $WTI
Little change in the weekly supply zone. The downside Z-wave appears to have started. Bearish momentum may continue if the weekly candle closes red, accompanied by relatively low volume.
Weekly closing will be key to confirming the continuation of the downside move.
— Chart Seekers | Let the Chart Speak.

#NIFTY50 & $OIL — TWO CHARTS, ONE BIG STORY! 📊
Both charts are showing interesting Wave structures, and their potential correlation is worth watching closely.
🇮🇳 NIFTY 50 — Weekly Outlook
CMP: 23,053
Support zone: 22,343–21,881
Extended downside possibility: 21,169–20,923
If the corrective structure completes, Wave (C) could potentially target 28,049–28,544.
🛢️ CRUDE OIL — Weekly Outlook
CMP: 101.95
Weekly supply zone: Around 105.49
Major monthly supply: 111.41–117.95
Potential downside support: 67.29–62.13


Chart Seekers retweeted
$CRCL
z wave is about to complete and reaching the demand zone if break then create all time low also

$CRCL
Market Structure & Wave Pattern: The chart outlines an ABC corrective/impulsive pattern. Wave (A) completed a previous bounce and reach around $136 - $139, while Wave (B) is forming near the lower key support area.
Decision Area & Key Support: Price is currently hovering around a Decision Area / Support-1 region near $68.00 to $60.00.
Bullish Scenario: If price holds above the primary support zone and breaks key overhead resistance, it sets up a long-term Wave (C) rally targeting $174.00+.
Bearish / Downside Risk: A breakdown below the red horizontal key level ("Must Break This for the downside") invalidates the immediate bullish structure and retest the support -1 even this would trigger a drop toward lower highlighted in orange ("Pending To Hit if the support Break") around the $40.00–$35.00 zone.
This is a technical analysis NFA and DYOR

Chart Seekers retweeted
$BTC DAILY OUTLOOK 📊
Bitcoin is currently trading around $77,300
at the key daily level. However, buying volume can be seen during the recent daily red candle, which is an encouraging sign.
From a wave perspective, the WXYXZ corrective structure on the daily timeframe appears to be completed. Still, an extension toward Weekly Support-1 cannot be ruled out.
Personally, I’m waiting for a weekly green candle and weekly closing confirmation before expecting stronger upside momentum.
📌 The daily structure looks interesting, but the weekly close will provide the final confirmation.
Read the Structure. Understand the Market.
⚠️ Technical analysis only. Not financial advice. DYOR.

$BTC | Daily Timeframe ⚠️
No clear sign of buying strength on the daily chart yet.
If BTC fails to close today’s daily candle in green, a retest of Support-2 remains on the table.
Patience is key. Let the daily candle confirm the move before expecting a recovery.
Chart Seekers — Let the Chart Speak. 📊

Chart Seekers retweeted
#NIFTY50 & $OIL — TWO CHARTS, ONE BIG STORY! 📊
Both charts are showing interesting Wave structures, and their potential correlation is worth watching closely.
🇮🇳 NIFTY 50 — Weekly Outlook
CMP: 23,053
Support zone: 22,343–21,881
Extended downside possibility: 21,169–20,923
If the corrective structure completes, Wave (C) could potentially target 28,049–28,544.
🛢️ CRUDE OIL — Weekly Outlook
CMP: 101.95
Weekly supply zone: Around 105.49
Major monthly supply: 111.41–117.95
Potential downside support: 67.29–62.13
Chart Seekers retweeted
$XAG
$SILVER
Silver (XAG/USD) — Weekly / Monthly Outlook
Silver is at a crucial level after a sharp rally and strong rejection from the higher supply zone.
🔻 Weekly Outlook: A decisive weekly close below 47.10 could confirm further downside toward 39.22.
📉 Monthly Outlook: If selling pressure continues, Silver may move into the Monthly Demand Zone between 39.22 and 30.11.
🔑 Key Resistance: 61.33 → 121.11
🔑 Key Support: 39.22 → 30.11
Technical analysis for educational purposes only. DYOR.
Chart Seekers — Let the Chart Speak.
#Silver #XAGUSD

Chart Seekers retweeted
$xau
$gold – Weekly Technical Outlook 📊
Gold is showing signs of a deeper correction after facing strong rejection from the $5,370–$5,597 supply zone.
My primary downside area remains the $3,600–$3,133 weekly/monthly demand zone, where I will be watching for a potential bullish reaction.
I'm bearish on Gold's since Jan -2026. I'm simply waiting for a healthier structure before the next major move.
Patience is key. Let the price come to your levels.
-- Chart Seekers -- Let The Chart Speak
#GOLD #XAUUSD

Chart Seekers retweeted
#Nifty 50 | Weekly Technical Outlook 📊
Waiting for This Week’s Price Action & Monthly Closing Confirmation
NIFTY 50 is trading near the crucial Monthly Demand Zone at 21,881–22,344. The coming price action around this zone could be decisive for the next major move.
🔹 Support Zone: 21,881–22,344
🔹 Weekly Resistance: 24,276–24,782
Bullish Scenario: If NIFTY sustains the monthly demand zone and buying pressure emerges, a recovery towards weekly resistance could be the first step. A sustained breakout above 24,782 would strengthen the bullish structure.
Bearish Scenario: Failure to hold the demand zone could extend the corrective structure, with the possibility of a deeper retracement towards the lower support area near 21,000.
🎯 My Approach: I’m waiting for this week’s price action and, more importantly, the monthly candle closing for final confirmation. Time spent consolidating around demand may improve the possibility of an upside move, but confirmation is essential.
No prediction without confirmation.
— Chart Seekers | Let the chart speak.
Educational technical analysis only. Not investment advice. I am not a SEBI-registered investment adviser or research analyst.


Chart Seekers retweeted
$BTC -- 4-HOUR TECHNICAL ANALYSIS 📊
Bitcoin’s potential 5-wave corrective structure appears to be complete, and now we’re waiting for confirmation from the higher timeframe.
🔹 Demand Zone: $80,390–$81,187
🔹 Resistance Zone: $83,586–$84,468
🔹 Bullish Confirmation: A strong weekly green candle could signal the next upside move.
For now, patience is the key. I’m waiting for the weekly candle to turn green before looking for confirmation of a bullish move.
Remember, the wave structure gives us a roadmap, but price action must confirm the direction. If demand fails to hold, further downside remains possible.
No FOMO. No assumptions. Let the chart confirm.
— Chart Seekers | Let the Chart Speak.
Educational analysis only. Not financial advice.

Chart Seekers retweeted
🚨 CRYPTO MARKET: WHAT’S THE NEXT BIG MOVE?
Are we preparing for the next big rally, or is another correction waiting?
👇 Join Chart Seekers X Space LIVE Link Below 👇
teapawt.net/i/spaces/1dxYlarZdOyJX…
As we will discuss:
📊 Market structure & key levels
₿ Bitcoin’s next possible move
🚀 Altcoin market outlook
🎯 Bullish and bearish scenarios
📅 21 October 2026 (Wednesday)
⏰ 10:00 PM IST
Let’s read the charts, understand the structure, and explore what the market may be signalling.
🔔 Set a reminder and join the discussion!
Chart Seekers — Let the Chart Speak.
Educational discussion only. Not financial advice. DYOR.
#Bitcoin #Crypto #Altcoins #ChartSeekers


Chart Seekers retweeted
$CRCL
Market Structure & Wave Pattern: The chart outlines an ABC corrective/impulsive pattern. Wave (A) completed a previous bounce and reach around $136 - $139, while Wave (B) is forming near the lower key support area.
Decision Area & Key Support: Price is currently hovering around a Decision Area / Support-1 region near $68.00 to $60.00.
Bullish Scenario: If price holds above the primary support zone and breaks key overhead resistance, it sets up a long-term Wave (C) rally targeting $174.00+.
Bearish / Downside Risk: A breakdown below the red horizontal key level ("Must Break This for the downside") invalidates the immediate bullish structure and retest the support -1 even this would trigger a drop toward lower highlighted in orange ("Pending To Hit if the support Break") around the $40.00–$35.00 zone.
This is a technical analysis NFA and DYOR
Chart Seekers retweeted
$ar
One more X Please

$AR
Nothing has changed since my post back in Nov-2025 and posting it again today.
This is another perfect example that those who survive the ‘B’ wave with patience and conviction are the ones who get rewarded in the ‘C’ wave.
Market noise shakes weak hands, but structure always speaks in the end.

Chart Seekers retweeted
$BTC 📊 LONG-TERM TECHNICAL ANALYSIS
Forget the daily noise. Forget the FUD, FOMO & emotions.
Zoom out. Read the structure. Follow the trend. 📈
Markets move in cycles, and patience is part of the game.
This video breaks down the long-term chart structure, key levels & possible roadmap.
🎯 Let the Chart Speak.
DYOR | Technical Analysis Only | Not Financial Advice
Chart Seekers retweeted
vechain:native has started knocking on resistance door. 🐕🚪
After being called a “shitcoin” throughout the bear market.
VET said:
“Keep that same energy. I’ll vet the shit out of your shorts.” 😂📈
Resistance: 0.0349 → 0.0591 VET: “Excuse me, I have some old haters to visit.” 😭💀
From “shitcoin” to “shit, it’s pumping.” 🚀🔥

🚨 $VET HOLDERS, WAKE UP! 😂
VET has been sleeping so long even the EMA stopped checking on it. 💤
But now the chart is like:
“Guys… I might finally go outside.” 🚀😂
🎯 Resistance: $0.0344
🔥 Next zone: $0.0591
👀 Bull case: $0.14+
Will VET finally break out of the crypto retirement home, or is it going back to sleep? 😂
What’s your target? 👇

Chart Seekers retweeted
creditcoin-2:native after surviving the bear market:
Bear Market: “I’m finished.” 🐻
Creditcoin: “Bro… I was just charging.” 😂🔋
Now, if the bear run is finally coming to an end, some sleeping alts are slowly waking up… 👀
And Creditcoin looks READY TO TEST THE RESISTANCE AGAIN. 📈🔥
