

Fulltime Crypto Trader & Investor 📈 | Tweets are not financial advice | TG: https://teapawt.net/t.co/j7IcSHcJXs | YT: https://teapawt.net/t.co/D1PbYpJroi |
Joined October 2017
- Tweets51.8K
- Following560
- Followers414K
- Likes121K




Pinned Tweet
Educational Thread Overview 📚
Below, you can find all my educational threads about subjects like Profit Taking, Risk Management and others. 👇
$BTC Back at the level we've seen so many times before.
- Topped price in 2021 during the first big rally
- Topped price the second time in 2021 before the bear market
- Held as support in 2024 before the bull market continued
- Held on the initial test in the summer of 2026 causing a big move
- Here we are again.
This $50K-$60K region has been key for the price of Bitcoin for years. I won't have to tell you that it is important to see buyers step in around this region. The 2024 summer lows from the Yen carry trade sit at $49K and that was during big black swan like event at the time. It would be a weak sign if this were to start trading back down there in my opinion.

$ETH Back at the big support level that has been tested multiple times over the past 3 years.
- October 2023 before the big rally
- April 2025 after the tariff crash right before Tom Lee & Bitmine pumped it up to $5K
- This summer 2026 before the big bounce
- Here we are
This is a key area and one I would want to see the bulls defend at all costs. Next support up would be that tariff low at ~$1350. Above, $1750 generally is the level where if price accepts back above it, we see a bigger move up.

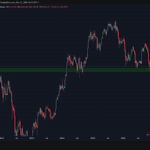
$BTC High timeframe chart simplified 👇
Price swept the bear market lows and is bouncing as we speak. So I'm looking for this to start marking out a potential range between ~$58K-$66K.
If $58K is lost, the $49K-$52K area comes into play.
If the bulls can break out of this local range and get above the weekly 200MA/EMA in the ~$68K region, that'd signal bulls are back in control to me.
With those levels all marked out, it is now just a matter of waiting and being patient.

Daan Crypto Trades retweeted
$BTC In 2022, the market bottomed on the 21st of November so this is exactly 4 years ago now.
News lows made, putting the total bear market duration at 400+ days now.
4 Cycle theory has always been a strong guideline for this market and it has proven itself pretty accurate yet again.
But while the dates line up pretty well, the percentages and moves have not. 2025 closed red and this year likely will too. Never before has Bitcoin closed 2 consecutive years in the red.
This would also be the smallest bear market drawdown by far if it were to bottom in the $50K region. But that is a trend we've already been seeing a long time. Both the ups and the downs are getting smaller with every cycle.

$BTC Just shows how much impact such a "small" amount of upwards pressure has in this market in its current state.
Takes ~$2B of long liquidations to drop -10%.
Takes ~$200M in short liquidations to gain it back.


$BTC Back at $60K.
Lots of successive short squeezes as shorts try to rush through the door tping or getting liquidated during a thin liquidity weekend.

$BTC Back at $60K.
Lots of successive short squeezes as shorts try to rush through the door tping or getting liquidated during a thin liquidity weekend.
$BTC In 2022, the market bottomed on the 21st of November so this is exactly 4 years ago now.
News lows made, putting the total bear market duration at 400+ days now.
4 Cycle theory has always been a strong guideline for this market and it has proven itself pretty accurate yet again.
But while the dates line up pretty well, the percentages and moves have not. 2025 closed red and this year likely will too. Never before has Bitcoin closed 2 consecutive years in the red.
This would also be the smallest bear market drawdown by far if it were to bottom in the $50K region. But that is a trend we've already been seeing a long time. Both the ups and the downs are getting smaller with every cycle.
$BTC Total Open Interest has now dropped by $35B by over -40% in just 2 months.
That is one crazy amount of capital removed from the markets in such a short time span.
In terms of percentage this was equal to the 10/10 flush in open interest.

The market rarely gives you the entry you planned for at the exact level you wanted.
Being a few percent off but actually in the trade usually beats waiting for perfect and missing it entirely.
This also means your invalidation or stop loss needs room for error in case a move extends past your entry area.
Almost $2B liquidated in Crypto the past day.
Nearly $10B in the past few weeks.
Stock market lost $9T in value in the past 6 weeks.
Crazy scenes. Massive unwind across all markets.

$BTC Tends to see a retest of its Weekly 200MA/EMA after breaking away from it.
But with last week's close it has lost these and bulls aren't making a good effort to retake it this week either.
The weekly 200MA is generally considered solid value for high timeframe spot buys but you can see last bear cycle price did lose it for about ~7 months before finally retaking it again.

$BTC Trading back below the high volume node from the 2024-2026 years.
Price has spend a big amount of time around that area. That would be the first area of interest for the bulls to retake again when this eventually bounces.
But so far the bears have been in control heavily.


$BTC Low timeframe range has been chopping up and down every few hours. Would expect a bigger move again once this breaks.

$BTC has not seen 3 consecutive green hourly candles in more than 2.5 days.
The last daily candle that gained +2% or more was 16 days ago.
The last green weekly candle was 54 days ago.
$BTC Heavily selling off during the US market hours pretty much perfectly every day.
Which makes sense if you see the insane ETF outflows we've been seeing the past week. Yesterday alone was -$582M.
Market desperately needs a break from that heavy spot selling or show signs of absorption which we've both not been seeing so far.
Last regular trading day coming up before we head into the weekend so let's see how markets digest the post $ANT IPO

$BTC Price action has been incredibly choppy.
Most action has come right at the US market open and closes. Every move is quick and mainly just consists of shorts getting squeezed without any proper spot bid.
The weekly open has been capping price during all these days. Price mostly bleeds outside of these quick squeezes and retraces.
Doubt we remain in this ~$64K region until the end of the week to be honest. Likely to see this move away from this area the moment the weekly open or ~$63K level below gives in.

No market has been safe this week.
Generally these kind of sell offs across all markets are signs of some major fear and usually forced selling.

Price reclaiming a level it lost is often a stronger signal than price holding it in the first place.
Failed breakdowns tend to trap a lot of people on the wrong side.

The Total Crypto Market cap has been in this giant range for the past 9 months now.
Bouncing between ~$2T-$2.7T
It doesn't hurt to put these levels on your chart and keep an eye on them. They correspond roughly with $60K & $80K for $BTC.
Don't get too bearish near the bottom and bullish near the top is generally a decent guideline.
And if you fail a breakout/breakdown that's a big reason to pay attention.
