

Deputy Chief Meteorologist @metoffice ⛅ | Weather Images Editor @RMetS 📖 | Research: https://xitter.cf/t.co/QOWsDQrbsC 📈 | Own views
- Tweets25.8K
- Following2.4K
- Followers9.4K
- Likes21.1K




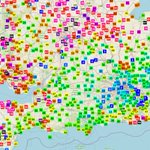





ALT A map showing 38.1°C recorded at Kew Gardens. This makes it the hottest day of the year so far.


ALT An map of the UK showing 35.3°C in Gogerddan meaning Wales have provisionally recorded their hottest August day on record.

ALT Days without rain (10 10 Aug) Wisley, Surrey = 55 days Heathrow, London = 49 days Odiham, Hampshire = 49 days Coningsby, Lincolnshire = 46 days Andrewsfield, Essex = 45 days Swanage, Dorset = 42 days


ALT The image has the Met Office logo and a news release banner dated 29 July 2026. Overlaid text reads: “New June daily temperature records heading into the record books”.


ALT A dark grey background scientific line chart titled 'UK Absolute Annual Maximum Temperature (1875–2026*)'. The y-axis shows temperature from 24°C to 42°C, the x-axis shows years from 1875 to 2026. The annual maximum temperature is shown as a bold red line. A white line shows the 10-year running mean, illustrating a clear upward trend particularly from the 1990s onward. A dashed grey line shows the linear trend of +0.15°C per decade. A horizontal dashed white line marks the 1991–2020 average of 33.5°C. The UK all-time record of 40.3°C set in 2022 is annotated in the upper right. The provisional 2026 value of 37.3°C is marked with a red dot and white label, the 5th hottest year in the 152-year record.