

r + neuroscience + illustration + web design - - - formerly @posit_pbc - - - tiny drawings: https://xitter.cf/t.co/orj43EKkri
- Tweets620
- Following350
- Followers2.2K
- Likes1.8K


ALT Teacups, Giraffes, and Statistics

ALT Learn statistics and R coding

ALT For students, scientists, and teachers

ALT Get started now, the giraffes are waiting



ALT Image of Hadley Wickham next to him there is text "A survey of changes around the Tidyverse package in R" Osun RUG Nigeria, Friday, 28th of October 2022 at 4pm WAT


ALT Graph with the GBBO logo in the form of a tiered drip cake. Each tier represents an episode. The text reads: Race to the top Each contestant from the tenth season is represented by a drip, charting their way from the original baker's dozen to the final three. The length of the drip shows their place in the technical. The baker with the poorest technical score (the longest drip) is seldom the one to leave the tent.


ALT A screenshot of the rstudio::conf(2022) workshop "Graphic Design with ggplot2", available via https://rstudio-conf-2022.github.io/ggplot2-graphic-design/

ALT A screenshot of the title slide of that workshop.

ALT The motivational example illustrating the capability of ggplot2 (custom colors, facets, smoothing, theming) and the data set used for the workshop (bike sharing daat from London via TfL)


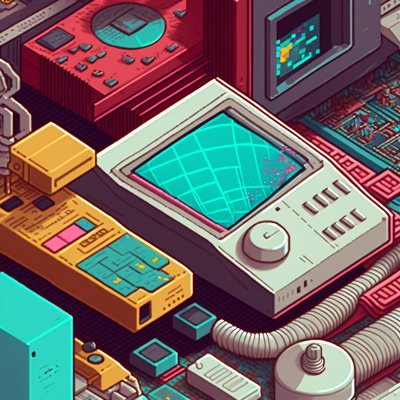


ALT Several tables, each filled with numbers. Text from the story reads: The professor had a lot of numbers: So many that she didn't keep them in spreadsheets any more. She kept them in a program called a database beside numbers that told her how many midwives there were and how many children had older sisters or younger brothers and a thousand other things.

ALT giant yawning city in the distance, our numbers are marching in to become data inside the database. Text reads "Welcome to the database"

ALT little program blocks with faces sit on swings above the database, using fishing poles to catch numbers and pull them up out of the database. Text reads: "her database had so many numbers that she couldn't think about them one by one. Instead, she wrote programs to make sense of them. Some programs chose numbers..."

ALT Little programs as blocks are moving numbers, sorting, ordering and arranging them after pulling from the database. One throws them into rolling carts to ship off to a program that turns the numbers into graphs. Text reads: "...looked for patterns...or turned those patterns into pictures."

ALT Red background with the Washington D.C. skyline and rstudio::conf(2022) written on top.


