

Rightsizing your cybersecurity investment with unmatched clarity and confidence. Find us at https://xitter.cf/t.co/B6kdk7BZwM
- Tweets58
- Following7
- Followers7
- Likes27






ALT "Screenshot from Derive 2.0 showcasing Reference Class Forecasting. The 'Loss Magnitude' section displays best-case ($0.001), most likely ($107,711,696), and worst-case ($274,216,000) scenarios with a confidence level of 20.5. A red arrow points to a probability distribution graph with data visualized as dots and trendlines. The caption reads 'Shift from opinions to data-driven decisions,' emphasizing advanced forecasting techniques."

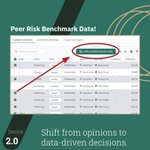
ALT "Screenshot from Derive 2.0 highlighting the use of peer risk benchmark data. The interface displays a table of scenarios under 'Current Defenses,' with details like agent, state, surface, and expected loss. A red arrow points to the 'Apply/Update Dialed Data' button. The caption reads 'Shift from opinions to data-driven decisions,' emphasizing the integration of benchmark data for risk analysis."

ALT "Screenshot from Derive 2.0 showcasing flexible control and plan crafting. The interface highlights the 'Guards' section, with options to add a description and associate plans such as 'Current defenses,' 'Automated defenses,' and 'Flight (not fight).' A red arrow points to the 'Associated plans' field. The caption reads 'Shift from opinions to data-driven decisions,' emphasizing streamlined control-plan customization."

ALT "Screenshot from Derive 2.0 highlighting the 'Scenarios' page, with a red arrow pointing to its menu option. The page displays a list of scenarios under consideration, including details like agent, state, intent, valuable, and surface. Options to create, import, and generate scenarios are visible. The caption reads 'Shift from opinions to data-driven decisions,' emphasizing dedicated tools for comprehensive scenario management."

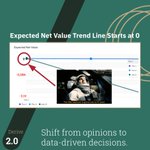
ALT "Screenshot from Derive 2.0 showing an 'Expected Net Value' trend line graph starting at 0. The chart compares Plan A, Plan B, and Plan C over three years, with values ranging from -$1M to $0. An arrow highlights the starting point at 0. A humorous image overlay features an astronaut with the caption 'This little maneuver is gonna cost us 51 years.' The caption reads 'Shift from opinions to data-driven decisions,' emphasizing precise financial forecasting."

ALT Screenshot from Derive 2.0 showing a 'Comparison of Risk by Plan' graph for a 2054 Vault Raiders Risk Assessment. A red arrow points to the home button in the navigation menu and the title of the image is labeled 'Desserts First.' The graph displays probability curves for Plan A, Plan B, and Plan C. The caption reads 'Shift from opinions to data-driven decisions,' emphasizing organized cyber risk analysis and strategic planning.

ALT Screenshot from Derive 2.0 with a financial scenario analysis for London, featuring inputs for best-case (£10,000), most likely (£10,000), and worst-case (£10 billion) scenarios. A bubble chart visualizes the data distribution across financial ranges. The caption reads 'Shift from opinions to data-driven decisions,' emphasizing informed scenario planning.

ALT Screenshot of the Derive 2.0 login page highlighting accessibility compliance with WCAG 2.2. Icons representing accessibility features, like vision and mobility aids, are shown above the login interface. Users can log in via email, passkey, Google, or Microsoft. The caption reads 'Shift from opinions to data-driven decisions,' emphasizing inclusive design and accessibility.

ALT Screenshot of the Derive 2.0 interface showcasing the Instant Search feature in the 'Plans & Controls' section. A search for 'backup' is highlighted, displaying results like 'Backups and Failovers' with options to delete or edit plans. The caption reads 'Shift from opinions to data-driven decisions,' emphasizing streamlined data management and actionable insights

