

Investor Learner Observer
Joined September 2023
- Tweets29.4K
- Following102
- Followers20.6K
- Likes3.7K
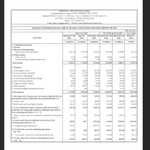
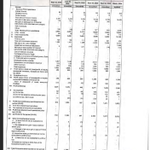

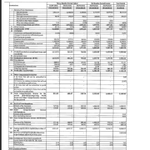

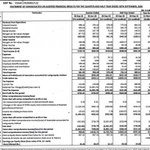



30th Oct 2026 Q2FY27 Results Snapshot:-
#Q2Results #Q2FY27 #Nifty
🚩Decent / Good / Blockbuster👏😃🔥
1) Navin Fluorine International (Solid)(Consistent)
2) Ramkrishna Forgings (Blockbuster)
3) GE Vernova T&D India (Solid)(Consistent) (Order bookings up 52% YoY)
4) Syrma SGS Technology (Decent)(Margin down Slightly)
5) Advait Energy Transitions (Solid)(Margin Expansion)
6) Aether Industries (Good)
7) Sathlokhar Synergys E&C Global (SME) (Blockbuster)
8) Resonance Specialities (Blockbuster)(Solid Margin Expansion)
9) Asian Energy Services (Robust)
10) Smartworks Coworking Spaces (Decent)(FY27 revenue growth guidance revised upward to 33–35% from 28–30%, backed by strong enterprise demand and a growing pipeline of large deals)(Company has maintained its normalised EBITDA margin guidance of 19–20% trending towards upper band and its target of adding 2.5–3 million sq. ft. annually)
11) Bank of Baroda (NII up 9%)(Operating Profit up 50.9%)(PAT up 35.8%)(Advances up 18.3%)(Deposits up 16.4%)
12) Prizor Viztech (SME) (Blockbuster)
13) Welspun Living (Decent)(Margin Expansion)(Home textile exports grew 18.3% YoY)(US pillow business grew 2.4x YoY in Q2 with both manufacturing facilities operational and remains on track to double revenues in FY27)(Looking ahead, we remain focused on sustaining double-digit growth, maintaining margins in the low teens, improving returns on capital and generating strong cash flows)
14) GMDC
15) Jio Platforms (Good)(Monthly ARPU ₹218.8 vs ₹215.6 QoQ)(Per capita data consumption was 44.2 GB/ month with total data traffic growth of 22.1% YoY)Total subscriber base of over 54.2 Cr with trailing twelve months net adds of 3.6 Cr)(JPL delivered double-digit Revenue growth across Connectivity (11%) and Digital Services (16%))
16) Delhivery (Solid)(Express Parcel Shipments up 32.1%)(PTL Freight Tonnage up 14.2%)(Adj. EBITDA up 48.2%)
17) Aditya Vision (Decent)(SSSG rebounded to 18% in H1FY27)(Expanded to 214 stores)
18) Gail (Solid)(Margin Expansion)
19) Max Healthcare Institute (Good)(Track)
20) Ajanta Pharma (Solid)(Margin Expansion)
21) Sportking India (Solid)(Margin Expansion)
22) IOL Chemicals & Pharmaceuticals (Solid)(Margin Expansion)
23) Indian Oil Corporation (Solid)(Margin Expansion)
24) Msafe Equipments (SME) (Solid)(Margin down Slightly)(We continue to target approximately 50% revenue growth in FY27)
25) Dhanuka Agritech (Good)(Margin up)
26) Shree Rama Multi-Tech (Good)(Lower other income dragged PAT down)
27) Emami Paper Mills (Blockbuster)
28) Zodiac Energy (Solid)
29) NTPC Green Energy (Decent)
30) Sharda Cropchem (Good)(We continue to maintain our FY27 revenue growth guidance of 10–15%)(We also expect EBITDA margins to improve through the year and remain between 18% and 20% for FY27)
31) Juniper Green Energy (Blockbuster)
32) Aditya Birla Capital (Decent)(Aggregate PBT up 32%)
33) Reliance Industries (Decent)(Growth Mostly led by O2C segment)(O2C Revenue up 44.2% led by sharp increase in crude and product prices)(Prices for most of the downstream chemical products were up 25-35% YoY, driven by strong feedstock prices)(O2C EBITDA increased by 67.9% YoY with a steep rise in transportation fuel cracks and downstream petrochemical margins)
34) Sugs Lloyd (SME)(Decent)
35) SJVN (Solid)
36) Vadilal Industries (Solid)(Margin Expansion)
37) Nitta Gelatin India (Solid)(Margin Expansion)
38) Nahar Spinning Mills (Decent)(Margin Expansion)
39) Ratnaveer Precision Engineering (Solid)
40) Motherson Sumi Wiring India (Margin down)
41) Bharat Electronics
42) Spandana Sphoorty Financial (Solid)(AUM up 31%)(Disbursement up 59%)(NII up 86%)(PPOP +₹79 Cr vs -₹40 Cr YoY)
43) Lodha Developers (Basis the strong performance in H1, we expect to easily exceed our profit guidance for the year)
44) Affle 3i (Good)(20% growth engine)
45) LCC Projects (Decent)
46) CORONA Remedies (PAT & PAT Margins were lower on account of higher depreciation & amortization charge for our newly commissioned facilities & acquisition of brands, from which revenue contribution are expected to build up over the coming quarters)
47) Narayana Hrudayalaya (Good)(Consolidated Revenue excl. UK up 22.6%)(Consolidated EBITDA excl. UK up 27.8%)(India revenue grew 16.6% YoY, driven by higher patient volumes, complex procedures and a 75.7% rise in international patient revenue; India hospitals EBITDA margin expanded to 26.8% from 23.8% a year ago)
48) Tilaknagar Industries (Volume at 8.9 mn cases up 160%)(EBITDA up 143%)(While primary volumes in Q2 have remained flattish, our secondary volumes have remained robust and shown an impressive 8% growth on QoQ basis with Imperial Blue secondaries growing at 8.5% and existing business secondaries growing at ~7%)
49) Arihant Capital Markets
50) True Colors (SME) (Margin Expansion)
51) Madhusudan Masala (SME) (Margin down)
52) Updater Services (Margin Expansion)
53) Taneja Aerospace & Aviation
54) IRM Energy (Solid)(Volume up 12.02%)(EBITDA up 77.2%)(PAT up 102.5%)
55) Chemkart India (SME)(Blockbuster)
56) Pune e-Stock Broking (SME) (Good)
57) Andhra Cements (Solid)(Margin Expansion)
58) Nahar Polyfilms
59) Fabtech Cleanrooms (SME) (Solid)(Management expects to recover the margin compression through higher volumes in Q3 and Q4 FY27. H2 FY27 PAT is expected to be higher than H1, aided by execution phasing, operating leverage on a larger revenue base and stabilising input costs)(Order book of ~₹470 Crore, more than double the ₹199 Crore reported as on 31st March 2026. The hot pipeline stands at ₹600 Crore out of a total offered pipeline of ₹1,250 Crore)
60) DCM Nouvelle (Solid)(Margin Expansion YoY but down QoQ)
61) India Finsec
62) Andhra Paper (Margin Expansion YoY but down QoQ)
🚩Bad / Poor / Weak 😠😡🤬
1) Go Fashion (Out of Fashion)
2) Borosil Renewables (Margin down)
3) Xchanging Solutions (Flat)
4) TTK Healthcare (Margin down)
5) Vinati Organics (Margin down)
6) Globus Spirits (Margin down)(Prestige & Above Sales Volume up 64% YoY)(Regular & Others Volume up 16% YoY)
7) DMCC Speciality Chemicals (Margin down)
8) Zee Entertainment Enterprises (Margin down)
9) Crizac
10) Sun TV Network
11) Indigo Paints (Margin down)
12) Indraprastha Gas (Margin down)
13) Prataap Snacks (Margin down)(we remain confident of delivering strong double-digit revenue growth in FY27)
14) Ganesh Housing
15) Sagar Cements (Margin down)(As Expected)(Volume up 26%)
16) Responsive Industries
17) Finolex Industries (Margin down)
18) HRS Aluglaze (SME)(Margin down)
19) GMR Power & Urban Infra
🚩Mixed / Neutral / Average🙄🆗😑
1) Skipper (Export order inflows hit a record ₹1,055 crores in Q2, yet reported export revenue fell 46% YoY as customers deferred shipments waiting for elevated shipping freight to cool)(Full-year 15% revenue growth guidance is maintained, but management flagged that at worst it may see a 1–2% drop (i.e., 13–14%) due to geopolitical uncertainties, elevated shipping freight, and those shipment deferrals. Per an analyst's math, H2 revenue growth needs to be ~21.6% to hit the 15% full-year target)
2) LIC Housing Finance (Below Avg)(Outstanding Loan Portfolio up 5%)(Total disbursements up 11%)(NII up 2%)(PAT up 11%)
3) Kirloskar Ferrous Industries (Margin down)
4) Aarti Industries (Margin down)
5) Gabriel India (Margin down)
6) Vimta Labs (Avg)
7) Quess Corp
8) Phoenix Mills (Avg)
9) Network18 Media & Investments (Margin Expansion)
10) Grover Jewells (SME)(Solid Margin Expansion)
11) Tempsens Instruments (Margin down)(Track)
12) Pranav Constructions (Margin Expansion)
13) SPR Auto Technologies (Margin down)(As expected)
14) Sealmatic India (SME)(Margin Expansion)
15) Sun Pharmaceutical Industries
16) RattanIndia Power (YoY Margin Expansion)
17) Varun Beverages (Margin down)(Consolidated sales volume grew by 28.7% to 354.4 Mn cases)(Gross margin declined by 334 bps to 53.1% in Q3 CY2026, primarily due to higher packaging material costs, including preforms, shrink films, closures, and cans, driven by geopolitical disruptions)
18) Intellect Design Arena (Weak)(Growth rate down)
19) Engineers India (Revenue down but Margin Expansion)
20) Shree Renuka Sugars (Revenue down but Margin Expansion)
21) Best Agrolife (Revenue down but Margin Expansion)
22) Anuh Pharma (Revenue down but Margin Expansion)
23) Nila Spaces (Revenue down but Margin Expansion)
24) Medi Assist Healthcare Services (Margin Expansion)
25) HLV
26) Share India Securities
27) Ujaas Energy (Margin Expansion)
28) Pudumjee Paper Products
29) Dixon Technologies (Margin down)
30) PB Fintech (Numbers are good)(But that regulatory thing is still there which will impact in major ways)
31) Vadilal Enterprises (Margin down)
32) Artemis Medicare Services (Margin down)
33) Akme Fintrade (India)
34) SIL Investments
35) Nahar Capital & Financial Services
36) Almondz Global Securities
37) General Insurance Corporation of India
38) New India Assurance Company (No view)
39) Kuber Udyog (No view)
GMR Power & Urban Infra — Q2FY27 Results 🔔
#Q2Results #Q2FY27 #GMRpower
Revenue ₹1527.48 Cr vs ₹1810.36 Cr
(-15.63% YoY┃-10.42% QoQ)
EBITDA ₹352.56 Cr vs ₹363.43 Cr
(-2.99% YoY┃-22.26% QoQ)
EBITDA Margin 23.08% vs 20.08% YoY & 26.59% QoQ
PBT (Excl. Exceptional) -₹49.87 Cr vs -₹157.60 Cr YoY & +₹8.87 Cr QoQ
PAT from continuing operations
+₹153.99 Cr vs +₹895.04 Cr YoY & -₹35.37 Cr QoQ
(-82.80% YoY)
PAT +₹153.97 Cr vs +₹894.70 Cr YoY & -₹35.38 Cr QoQ
(-82.79% YoY)
PAT After Minority interest
+₹154.10 Cr vs +₹888.39 Cr YoY & -₹41.48 Cr QoQ
(-82.65% YoY)
Other Income ₹63.25 Cr vs ₹111.68 Cr YoY & ₹44.02 Cr QoQ
This Q2 Exceptional Gain of ₹225.91 Cr
In Q2FY26 Exceptional Gain of ₹1022.97 Cr


Almondz Global Securities — Q2FY27 Results 🔔
#Q2Results #Q2FY27 #Almondz
Revenue ₹39.40 Cr vs ₹33.73 Cr
(+16.81% YoY┃-11.46% QoQ)
EBITDA ₹6.87 Cr vs ₹5.14 Cr
(+33.66% YoY┃-31.09% QoQ)
EBITDA Margin 17.44% vs 15.24% YoY & 22.40% QoQ
PBT Before Share of JV/Associates ₹4.86 Cr vs ₹2.90 Cr
(+67.59% YoY┃-39.25% QoQ)
PBT ₹10.01 Cr vs ₹4.42 Cr
(+126.47% YoY┃-21.18% QoQ)
PAT ₹9.10 Cr vs ₹3.87 Cr
(+135.14% YoY┃-27.37% QoQ)
PAT After Minority interest ₹8.28 Cr vs ₹3.64 Cr
(+127.47% YoY┃-28.99% QoQ)
Other Income ₹0.69 Cr vs ₹0.27 Cr YoY & ₹0.46 Cr QoQ


Andhra Paper — Q2FY27 Results 🔔
#Q2Results #Q2FY27 #Andhrapaper
Revenue ₹426.07 Cr vs ₹362.08 Cr
(+17.67% YoY┃+8.20% QoQ)
EBITDA ₹28.84 Cr vs -₹6.81 Cr YoY & ₹48.78 Cr QoQ
(-40.88% QoQ)
EBITDA Margin 6.77% vs -1.88% YoY & 12.39% QoQ
PBT +₹5.72 Cr vs -₹27.75 Cr YoY & +₹40.55 Cr QoQ
(-85.88% QoQ)
PAT +₹4.27 Cr vs -₹20.26 Cr YoY & +₹30.32 Cr QoQ
(-85.92% QoQ)
Other Income ₹9.82 Cr vs ₹10.18 Cr YoY & ₹21.65 Cr QoQ

India Finsec — Q2FY27 Results 🔔
#Q2Results #Q2FY27 #Finsec
Total Revenue ₹30.97 Cr vs ₹20.17 Cr
(+53.56% YoY┃+6.30% QoQ)
PBT ₹11.16 Cr vs ₹7.68 Cr
(+45.25% YoY┃+18.56% QoQ)
PAT ₹8.13 Cr vs ₹5.54 Cr
(+46.87% YoY┃+18.14% QoQ)
PAT After Minority interest ₹5.77 Cr vs ₹3.93 Cr
(+46.89% YoY┃+18.14% QoQ)

DCM Nouvelle — Q2FY27 Results 🔔
#Q2Results #Q2FY27 #DCM
Revenue ₹318.02 Cr vs ₹238.88 Cr
(+33.13% YoY┃+10.64% QoQ)
EBITDA ₹34.92 Cr vs ₹9.12 Cr
(+282.89% YoY┃-28.55% QoQ)
EBITDA Margin 10.98% vs 3.82% YoY & 17.00% QoQ
PBT +₹24.93 Cr vs -₹2.05 Cr YoY & +₹38.13 Cr QoQ
(-34.62% QoQ)
PAT +₹17.36 Cr vs -₹2.42 Cr YoY & +₹27.53 Cr QoQ
(-36.94% QoQ)
PAT After Minority interest
+₹17.94 Cr vs -₹1.95 Cr YoY & +₹27.98 Cr QoQ
(-35.88% QoQ)
Other Income ₹2.14 Cr vs ₹0.63 Cr YoY & ₹1.74 Cr QoQ

Nahar Capital & Financial Services — Q2FY27 Results 🔔
#Q2Results #Q2FY27 #Nahar
PBT ₹56.14 Cr vs ₹17.67 Cr
(+217.72% YoY┃+11.16% QoQ)
PAT ₹27.22 Cr vs ₹20.38 Cr
(+33.54% YoY┃-59.63% QoQ)

Nila Spaces — Q2FY27 Results 🔔
#Q2Results #Q2FY27 #Nilaspace
Revenue ₹38.18 Cr vs ₹42.18 Cr
(-9.50% YoY┃-18.20% QoQ)
EBITDA ₹15.79 Cr vs ₹9.88 Cr
(+59.87% YoY┃-12.49% QoQ)
EBITDA Margin 41.37% vs 23.42% YoY & 38.67% QoQ
PBT ₹8.15 Cr vs ₹7.74 Cr
(+5.27% YoY┃-29.15% QoQ)
PAT ₹5.89 Cr vs ₹5.34 Cr
(+10.32% YoY┃-31.50% QoQ)
PAT After Minority interest ₹5.90 Cr vs ₹5.46 Cr
(+7.99% YoY┃-30.37% QoQ)
Other Income ₹4.05 Cr vs ₹4.55 Cr YoY & ₹3.23 Cr QoQ

Fabtech Cleanrooms (SME) — H1FY27 Results 🔔
#H1Results #H1FY27 #Fabtech
H1FY27 vs H1FY26
Revenue ₹133.23 Cr vs ₹76.19 Cr (+74.88% YoY)
EBITDA ₹9.71 Cr vs ₹4.86 Cr (+99.74% YoY)
EBITDA Margin 7.29% vs 6.38% YoY
PBT (Excl. Exceptional) ₹8.37 Cr vs ₹5.33 Cr
(+56.97% YoY)
PAT Before Share of JV/Associates ₹5.85 Cr vs ₹3.81 Cr (+53.60% YoY)
PAT ₹5.85 Cr vs ₹4.00 Cr (+46.16% YoY)
PAT After Minority interest ₹5.15 Cr vs ₹3.33 Cr (+54.98% YoY)
Other Income ₹0.77 Cr vs ₹1.01 Cr YoY
This H1 Exceptional loss of ₹0.20 Cr

HRS Aluglaze (SME) — H1FY27 Results 🔔
#H1Results #H1FY27 #HRS
H1FY27 vs H1FY26
Revenue ₹33.65 Cr vs ₹26.33 Cr (+27.79% YoY)
EBITDA ₹3.74 Cr vs ₹8.45 Cr (-55.72% YoY)
EBITDA Margin 11.12% vs 32.08% YoY
PBT ₹1.34 Cr vs ₹6.12 Cr (-78.17% YoY)
PAT ₹0.86 Cr vs ₹4.54 Cr (-81.02% YoY)
PAT After Minority interest ₹1.21 Cr vs ₹4.54 Cr (-73.37% YoY)

Nahar Polyfilms — Q2FY27 Results 🔔
#Q2Results #Q2FY27 #Naharpolyfilms
Revenue ₹258.93 Cr vs ₹172.30 Cr
(+50.28% YoY┃+61.92% QoQ)
EBITDA ₹39.70 Cr vs ₹27.77 Cr
(+42.96% YoY┃+161.86% QoQ)
EBITDA Margin 15.33% vs 16.12% YoY & 9.48% QoQ
PBT ₹33.82 Cr vs ₹23.08 Cr
(+46.57% YoY┃+235.63% QoQ)
PAT Before Share of JV/Associates ₹27.85 Cr vs ₹16.26 Cr
(+71.22% YoY┃+347.28% QoQ)
PAT ₹32.88 Cr vs ₹20.78 Cr
(+58.24% YoY┃+181.40% QoQ)
Other Income ₹4.07 Cr vs ₹5.50 Cr YoY & ₹4.63 Cr QoQ

Andhra Cements — Q2FY27 Results 🔔
#Q2Results #Q2FY27 #Andhracement
Revenue ₹165.98 Cr vs ₹77.85 Cr
(+113.20% YoY┃+16.75% QoQ)
EBITDA ₹14.22 Cr vs -₹4.48 Cr YoY & ₹3.74 Cr QoQ
(+280.21% QoQ)
EBITDA Margin 8.57% vs -5.75% YoY & 2.63% QoQ
PBT -₹37.66 Cr vs -₹41.92 Cr YoY & -₹47.77 Cr QoQ
PAT -₹28.35 Cr vs -₹41.92 Cr YoY & -₹35.93 Cr QoQ
Other Income ₹0.97 Cr vs ₹0.59 Cr YoY & ₹1.19 Cr QoQ

Finolex Industries — Q2FY27 Results 🔔
#Q2Results #Q2FY27 #Finolex
Revenue ₹1093.96 Cr vs ₹858.74 Cr
(+27.39% YoY┃+23.81% QoQ)
EBITDA ₹124.35 Cr vs ₹130.17 Cr
(-4.47% YoY┃+16.68% QoQ)
EBITDA Margin 11.37% vs 15.16% YoY & 12.06% QoQ
PBT ₹150.08 Cr vs ₹166.10 Cr
(-9.64% YoY┃+1.54% QoQ)
PAT ₹115.02 Cr vs ₹123.56 Cr
(-6.91% YoY┃+0.44% QoQ)
Other Income ₹55.33 Cr vs ₹57.75 Cr YoY & ₹75.33 Cr QoQ

Pune e-Stock Broking (SME) — H1FY27 Results 🔔
#H1Results #H1FY27 #Pune
H1FY27 vs H1FY26
Revenue ₹34.20 Cr vs ₹26.39 Cr (+29.60% YoY)
EBITDA ₹12.65 Cr vs ₹9.65 Cr (+31.13% YoY)
EBITDA Margin 37.00% vs 36.57% YoY
PBT ₹19.05 Cr vs ₹13.73 Cr (+38.78% YoY)
PAT ₹14.27 Cr vs ₹10.44 Cr (+36.78% YoY)
PAT After Minority interest ₹14.09 Cr vs ₹10.21 Cr
(+38.00% YoY)
Other Income ₹9.62 Cr vs ₹7.35 Cr YoY

Shree Renuka Sugars — Q2FY27 Results 🔔
#Q2Results #Q2FY27 #Shreerenuka
Total Revenue ₹1905.00 Cr vs ₹2489.00 Cr
(-23.46% YoY┃-10.15% QoQ)
EBITDA +₹29.60 Cr vs -₹182.20 Cr YoY & -₹76.30 Cr QoQ
EBITDA Margin +1.55% vs -7.32% YoY & -3.60% QoQ
PBT -₹201.90 Cr vs -₹401.30 Cr YoY & -₹315.90 Cr QoQ
PAT -₹193.90 Cr vs -₹369.30 Cr YoY & -₹251.50 Cr QoQ
PAT After Minority interest
-₹193.30 Cr vs -₹368.60 Cr YoY & -₹251.10 Cr QoQ
Other Income ₹16.30 Cr vs ₹37.50 Cr YoY & ₹11.10 Cr QoQ

Nitta Gelatin India — Q2FY27 Results 🔔
#Q2Results #Q2FY27 #Nitta
Revenue ₹168.82 Cr vs ₹138.07 Cr
(+22.27% YoY┃+19.84% QoQ)
EBITDA ₹47.54 Cr vs ₹25.73 Cr
(+84.74% YoY┃+37.96% QoQ)
EBITDA Margin 28.16% vs 18.64% YoY & 24.46% QoQ
PBT ₹46.14 Cr vs ₹25.52 Cr
(+80.79% YoY┃+35.82% QoQ)
PAT from continuing operations ₹36.14 Cr vs ₹18.89 Cr
(+91.29% YoY┃+42.95% QoQ)
PAT ₹35.92 Cr vs ₹18.38 Cr
(+95.35% YoY┃+42.64% QoQ)
PAT After Minority interest ₹35.92 Cr vs ₹18.43 Cr
(+94.94% YoY┃+42.64% QoQ)
Other Income ₹4.78 Cr vs ₹3.87 Cr YoY & ₹3.67 Cr QoQ

Kuber Udyog — Q2FY27 Results 🔔
#Q2Results #Q2FY27 #Kuber
Total Revenue ₹0.15 Cr
PBT ₹0.02 Cr
PAT -₹0.76 Lakhs

Grover Jewells (SME) — H1FY27 Results 🔔
#H1Results #H1FY27 #Grover
H1FY27 vs H1FY26
Revenue ₹320.75 Cr vs ₹288.58 Cr (+11.14% YoY)
EBITDA ₹18.15 Cr vs ₹6.60 Cr (+175.20% YoY)
EBITDA Margin 5.66% vs 2.29% YoY
PBT (Excl. Exceptional) ₹13.75 Cr vs ₹5.00 Cr (+174.92% YoY)
PAT ₹11.33 Cr vs ₹4.13 Cr (+174.65% YoY)

Responsive Industries — Q2FY27 Results 🔔
#Q2Results #Q2FY27 #Responsive
Revenue ₹204.89 Cr vs ₹313.75 Cr
(-34.70% YoY┃+6.23% QoQ)
EBITDA ₹29.63 Cr vs ₹76.60 Cr
(-61.32% YoY┃+27.10% QoQ)
EBITDA Margin 14.46% vs 24.42% YoY & 12.09% QoQ
PBT ₹8.39 Cr vs ₹54.65 Cr
(-84.65% YoY┃+130.62% QoQ)
PAT ₹6.49 Cr vs ₹53.26 Cr
(-87.81% YoY┃+136.99% QoQ)
Other Income ₹0.90 Cr vs ₹2.99 Cr YoY & ₹2.04 Cr QoQ
