

🗺️ Freelance -geospatial- web developer. ~ Contact via my website. ~ 'The end of the world is already here — it is just unevenly distributed.' 👨💻
Ohio
Joined April 2010
- Tweets1.5K
- Following711
- Followers351
- Likes4K








Malcolm retweeted

Azimut 0.3.3 is out!
Fly down into any valley in 3D, search for where a photo was taken from its skyline, and make maps ready to publish.
Free, open source, and running on your own machine. Can't wait to see what you do with it.
Please read below👇
github.com/OsintMeThat/azimu…
Malcolm retweeted

It's release day for the 2025 1-year American Community Survey, and for the first time we have data about electric vehicles, solar panels, and sewer systems.
Shown here: the percentage of households with an electric vehicle, mapped by PUMA so we get national coverage.
Over one-third of households have EVs in the top PUMAs: Silicon Valley (Palo Alto, Los Altos Hills, Cupertino) and in Irvine, CA.
The lowest, all under one percent: Pasadena TX (outside Houston), Morningside Heights/Hamilton Heights NYC, and rural southeast Arkansas. Usual margin of error caveats apply.
tidycensus is ready to go for the new 2025 data, so start your analyses today.
Malcolm retweeted

TU Delft 3D Open Cities Portal - A comprehensive catalog of open 3D city model datasets from around the world. This catalog aggregates CityJSON and CityGML datasets from various cities and regions. map.catalog.open3d.city/

Malcolm retweeted

(Re)Introducing... Limner!! Our conversational analysis tool, designed to help users analyze complex geospatial data.
With the help of Limner, users can analyze:
🌤️ Solar panel energy
🔥 Wildfire progression
🌊 Flood damage
element84.com/limner-homepag…

Malcolm retweeted

Hello, World! The squidmaps.io beta is here. Make a map worth sharing in just a few minutes.
Malcolm retweeted

It's been a while, but it's happening. ❤️ github.com/Leaflet/Leaflet/i…

Malcolm retweeted

Nice! …

MapLibre GL JS v6.15 is out, with flexible 2d projection support. Polar regions, National Grids, Worlds from movies/books/games - if you can imagine it, we can render in. makewithmaplibre.com/project…
Malcolm retweeted
Re:Earth Terrain - Open terrain tiles for 3D globes, served from the edge. CesiumJS & MapLibre, no auth, no key. terrain.reearth.land/


Malcolm retweeted

There is a heated discussion about RustGIS on Reddit!
reddit.com/r/gis/comments/1x…
I stopped posting/commenting on Reddit a few weeks ago. Not good for my mental health.
Here are my personal opinions about RustGIS:
Nobody is forcing you to use RustGIS. If ArcGIS/QGIS works well for you, that's great! Keep using it.
I believe in giving people choices. Competition and diversity drive innovation and ultimately benefit everyone. Why do we have so many car manufacturers, such as Toyota, Honda, BMW, and Tesla? They all serve the same basic purpose, but offer different features, experiences, and approaches.
The same applies to smartphones. We have iPhones and Android phones from Google, Samsung, Motorola, and others. Should we all use the same phone?
GIS software is no different. ArcGIS, QGIS, and RustGIS can coexist, each serving different needs and communities. I'm not trying to replace anyone's favorite GIS. I'm simply building another free and open-source option for people who might find it useful.
More choices are a good thing, especially in open-source software.
If you want to learn more about how RustGIS compares to other software, check out rustgis.app/comparison

Malcolm retweeted

QGIS is enforcing a no AI code policy, at all, I’m not a fan
Sounds to me like an open invite for someone to make a fork and make what Omarchy is doing with Linux, completely embarrassing LLMs and running with it
It saddens me a bit honestly. At tue same time, I’ve noticed that I don’t use QGIS anymore. I’ve had it docked for years and removed it a few weeks ago, completely uninstalled it, because for most visualisation work I’ve basically made my own tools that help me look at images based on my preferences of working. I would like QGIS and similar software to embrace the world we’re in today and make it easier to build things like that on top of what already exists but that’s a radical change right now
We’re in weird times for software
github.com/qgis/QGIS-Enhance…


Malcolm retweeted

Researchers put a dead salmon in an fMRI scanner, showed it pictures of humans, and asked it to guess their emotions.
The scan showed brain activity. In a dead fish.
Now, the recent study proved that the exact same thing is happening in artificial intelligence.
They call it the "Dead Salmons of AI Interpretability"
When we use tools like feature attribution, SHAP values, or mechanistic interpretability to see "inside the black box," these methods often generate plausible-looking explanations from completely meaningless computations.
You can completely randomize a model's weights and the "saliency map" explanation still looks perfectly valid.
You can nudge the data slightly and the entire narrative of why the ai made a decision completely rewrites itself.
the researchers call this a "crisis of non-identifiability."
the math we use to explain ai behavior is so overdetermined that it is making up stories instead of measuring ground truth.
this is a massive reality check for ai alignment and safety..
we are trusting frontier models with critical decisions based on "explanations" that are statistically equivalent to a dead fish having social emotions..
the fix? the authors argue we have to stop treating interpretability like a visualization tool and start treating it as a rigorous statistical inference problem.
if your explanation survives a random model check, a label shuffle, and an intervention test.. then maybe you actually understand the model. if not, you're just looking at a dead salmon.

Malcolm retweeted

PEOPLE GOT SCAMMED $4K BY LOVABLE, SO WE MADE IT 100% FREE
I'm starting a war on overpriced AI subscriptions. The worst offender of this is Lovable.
They have predatory pricing: once people start building, they are locked in and now have to pay thousands to progress.
We built freebuff to eliminate this:
1 / no subscriptions, no API keys
2 / zero lock in: we rebuilt all of Lovable's features and made them completely free
3 / code endlessly for hours each day without paying a dime
We don't even accept a credit card.
Lovable's $12B valuation is going to disappear real soon.
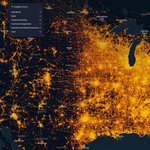
One cool feature of my camera map is the on-the-fly spatial search with #duckdb and #parquet sourced from from us census urban areas #gis #geospatial #webdev - no need for pre-processing all the data
xycameras.com/#12/39.93001/-…

ALT Spatial Text Search

#freebuff is looking like a very attractive alternative to co-pilot or one-off subscriptions for personal side projects
freebuff.com/

Added a small bookmark tool with auto-naming and collapsible legend. So many cameras, so little time!
xycameras.com/#11.75/39.9305…
