

The Generic Model Organism Database project: open-source software for genome-scale biological data.
- Tweets5.1K
- Following504
- Followers1.3K
- Likes48
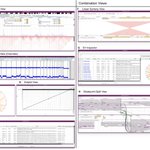





ALT Seven panels: A The Linear Genome View displaying gene annotations, quant signals, and a Hi-C track. B whole genome overview showing tumor vs normal sequencing coverage in the COLO829 cell line. C The Circular View gives an overview of long-range relationships within and between chromosomes (translocations in an SKBR3 cancer genome). D The Dotplot View shows relationships between two sequences (in this case the relationship between hg19 and hg38 human genomes). E The Tabular View summarizes features in a sortable, filterable list, showing in this example the SKBR3 variant calls from Sniffles. F The Linear Synteny View shows relationships between two genomes (in this case, peach and grape). G The SV Inspector allows inspection of structural variants by combining a Tabular View and a Circular View. H The Breakpoint Split View shows events such as gene fusions and translocations by aligning two Linear Genome Views and tracing the split or paired read mappings across the two views


