

Building tools for data/dev teams. @anfraAI (open-source analytics engine) @dbdiagram (200K MAUs)
Saigon and Singapore
Joined March 2008
- Tweets641
- Following884
- Followers747
- Likes380



Day 5 of building an open-source agentic BI in public. Today is a quick rant about {context,semantic} layer.
There has been a lot of discussions about semantic layer and context layer recently. And one argument that I came across is this: if the AI models are getting so good, do you really need semantic layers, or just the context layer is good enough?
Honestly, I don't understand why there's such an argument.
To me, semantic layers and context layers are 2 complementary things, they represent both the quantitative and the qualitative side of the business.
While the context layer obviously contains the messy business context across different documents, the semantic layer (aka the the metrics layer) represent the formularized, quantitative aspects of the business. And you need both in order to function well.
Not needing a semantic layers is like saying I can already describe my proof in English, why should I need to use some sort of mathematical formula with it?
Well of course you can describe your proof in English, but English (or any other human language) is an imprecise language, there can and will be different interpretation of the same thing. While not just use a indisputable, computable formula for it.
This is why in anfra we ship both a context layer with a powerful semantic search functionalities, and a semantic layer with an advanced semantic query language. Both are independent components that interact well together.
Am I missing anything of the arguments?
p/s: If you want to implement an BI that has the best practices of agentic analytics, give anfra a shot.
1
1
142
Everyone in data right now:
Ontology ontology ontology oncology
Semantic layer semantic layer semantics
Context layer context layer context context
data intelligence engineer intelligence intelligence
Same people, on their machine:
Markdown SQL yaml markdown sql yaml json
5
9
304
Day 4 of building an open-source agentic BI engine in public.
Over the weekend my colleague @imanthonytd built a prototype of anfra's desktop app, because… why not?
Here’s a rough demo (live recording).
Claude/Codex integration is done using using ACP, originally built by the @zeddotdev team. This way, users get AI directly from their Claude/ChatGPT subscription. They don't even need to install Codex or Claude Code app.
What do you guys think? Can this be the agentic alternative of Tableau Desktop or PowerBI Desktop?
Day 3 of building @anfraAI (open-source BI engine for agents) in public.
Today I asked Fable 5.2 to act like Jay-Z or Eminem and rewrite our landing pages.
Which one do you like better?
Excellent idea from @daniel_nguyenx


Day 2 of building open-source analytics engine in public. Let’s talk about low-cost, open-souce data stack.
Since building @anfraAI I have been trying this setup out, and it has soon become my new favorite open-source/almost $0 agentic data stack.
1. @duckdb (self hosted) or @motherduck free plans for data warehouse.
2. @dltHub and @getdbt for ELT (open-source). If it’s simple tables/sources, I might just skip them or hand-roll something with agents.
3. AMQL (amql.org) as a semantic layer, metrics definition. It ships with anfra. It is static-typed with composable/programmable consturcts (not YAML-based strings).
4. anfra as the open-source agentic analytics engine + custom BI apps frontend. Either self-host or free cloud.
The main cost is just usually hosting, which I typically go with a @Hetzner_Online VPS box ($7/mo), best bang for the bucks I can find.
If the data volume is low, I just go with Motherduck free plan (10 GB free storage) + anfra Cloud (free plan) to save the management hassle.
Contexts are either markdown files, dbt descriptions or Notion, that get ingested into anfra via anfra context layer.
All this is set up with coding agents (Claude Code, Codex or @opencode). I rarely look at the code anymore.
What you get:
- Interactive, customizable dashboards on top of a governed analytics backend
- Everything stored as code, checked in to Git
- Connect ChatGPT/Claude to anfra MCP and you get AI analytics with trusted metrics for free (no extra API token cost)
What does your low-cost agentic data stack look like?
NEW: We're open-sourcing the boring parts of BI
Everyone on my X feed is building custom data apps with @claudeai and Codex these days. I tried it too, and I see the appeal; you get complete freedom over the UI, interactions, and user experience.
But there's a catch: Building the UI is easy, building a trusted BI app isn't. You still have to handle all the unsexy infrastructure that makes a data app governed, secure and reliable to actually run a business on: metrics definitions, authentication, row-level security, caching, governance.
So we built anfra: the open-source engine for building trusted analytics with AI agents.
Think "@getdbt for BI apps", but built for coding agents.
- Open-source (Apache 2.0)
- Local-first & CLI-native
- Work with Claude Code, Codex, and your favorite coding agents
Built for data teams who want both the customization of custom-built data apps, and the trusted governance of an enterprise-grade BI tools.
See how it looks like below. Or see for yourself in just 10 minutes with your own coding agents: "Install anfra ai, connect to my warehouse, and build me a data app."
14
13
618
Our newest thing.

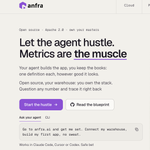
Introducing: anfra, an open-source engine for trusted analytics with AI agents.
Your coding agent builds the app in HTML, JS and any chart library. anfra connects it to governed metrics, with drill-downs, comparisons and lineage built in.
anfra.ai
Claude Code with Opus 4.8 spits out Chinese character (it means "explore").
Prompt and codebase all in English.

2
113
Now you can use Codex, Claude Code, Cursor, and other coding agents to build BI dashboards in Holistics.
A recent customer POC that used to take roughly a week was completed in 1 day by our data team.
The workflow is surprisingly simple:
→ Work locally in your IDE, git check out BI code
→ Ask agents to create metrics and charts
→ Let agents query real data and verify results
→ Preview dashboards instantly on the web
→ Publish with one click
What's interesting is that this wasn't built overnight.
Four years ago, we made a big bet that analytics should be treated like software: datasets, metrics, dashboards, permissions, and business logic should all live as code.
At the time, it felt like a "who cares?" architecture decision.
Today, it's the reason coding agents can understand, modify, validate, preview, and publish analytics assets end-to-end instead of just generating SQL snippets.
We didn't build a code-first architecture because of AI. But it turned out to be exactly what AI agents needed.

Is it just me or the new Google Analytics 4 is really bad for new people? I find the old GA3 works the best for simple use cases.
Granted UA and GA4 try to redo data structure to make it flexible, but their default UI is quite unintuitive.
What are people using these days?
2
4
198
Debugging SQLs with your team is usually a pain, because there's no easy way to quickly set up the test database environment.
Well, now you can.
RunSQL.com
4
172
Looking for a tool, JS SDK, or API service to generate a screenshot from a public URL.
Any recommendations?
2
5
197
What are the typical metrics that you’d normally look at weekly?
In this post, I differentiate between "business metrics" vs "customer metrics".
buff.ly/3RiRNqz

1
353
When I was working as a data engineer, when a business colleague asked for a particular metric, I was sometimes confused as to how to present the metrics to them. Until recently, I realized every metric has 2 forms: Interval and Point forms.
buff.ly/49SIiqn

1
207
🚀 Building dashboards using code
If you're a @holistics_bi user (BI analyst), soon you'll be able to easily switch between GUI and code-based interfaces to build your dashboards. This will allow you to:
1
182
1/ Have full control over the content and design of your dashboards
2/ Easily revert changes or make bulk updates
3/ Create graphs once and reuse them anywhere, anytime.
4/ Version control your dashboards with Git. Know who changes what and when.
1
107
"Modern Data Stack" is an exciting concept but a terrible name.
How would you call the next innovation in data stack? The "moderner data stack" 🥲?
Maybe we should copy web2 web3 and call it the "data2 era"