

Trying hard not to specialise.
Joined March 2009
- Tweets1.1K
- Following316
- Followers503
- Likes1.7K







John Harding retweeted

In 1972, the Amsterdam neighbourhood of De Pijp saw clashes between parents who wanted safer streets for kids and drivers who wanted to cut through.
I went to visit yesterday, 51 years later.
The traffic filters and playgrounds remain. It is a place many people want to live. 🧵
John Harding retweeted

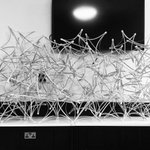
Bamboo Sculpture Workshop @QUBelfast
Students explored Gridshell structures through digital modelling and experimentation with ‘waste’ bamboo.
Thanks @je5 for a brilliant day!
@QUBarch @tellenibs @s_b_cullen
#InnovationTeachingFund
#Bamboo #CircluarEconomy #Geodesic
John Harding retweeted
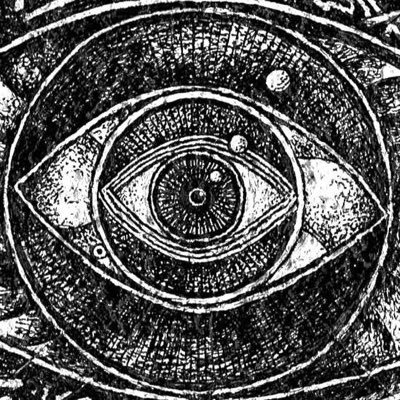
One of my all-time favorite animations
“Extrapolate” by @RijpmaJohan, 2016


John Harding retweeted

The UK is addicted to gas with 85% using it for heating. We also have least energy efficient housing stock in Western Europe. The mix makes us uniquely exposed to this gas price crisis. This graphic from Tado is still shocking - with heat loss from U.K. homes 3 X that of Germany

Small experimental bamboo sculpture made with MArch students Torin Kenny and Luke Collison as part of the @UniRdg_Arc final year show. Inspired by an earlier one-day workshop on bending active structures with @FormatEngineers.


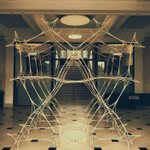
Exactly ten years ago we launched the Computational Design team back at Whitbybird/Ramboll by building a small plywood gridshell in the office entrance. It used principal curves to keep fabrication simple. Hard to believe it was so long ago @FormatEngineers !

Here was the node, picture by @jjsolly . The coach bolt really wasn't needed in the end.


Just been playing with my old Processing files from 13 years ago and finding lots of fun things. A really simple way to visualise Bézier curves for example.

John Harding retweeted

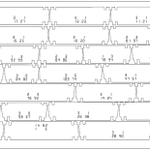
Amplitude diagrams for antennae arrays | The Bell System Technical Journal - American Telephone and Telegraph Company [1922] | archive.org/details/b00ellsy…


Just geometry pen plots for the time being! This time a Twisted Scherk Surface. Curves are generated using @KangarooPhysics Daniel Piker's very nice implementation of the heat method for geodesic distances: discourse.mcneel.com/t/heat-…

Also attempted on the Costa from a few weeks back by setting the heat sources along the boundary (cs.cmu.edu/~kmcrane/Projects…). The curves feel a little too dense here, but with more practice it could be a nice way to generate pen plot curves for 3d shapes with distinct boundaries.

