


"50 chart types for data visualization explained" by @jscharting #DEVCommunity dev.to/jscharting/50-chart-t…

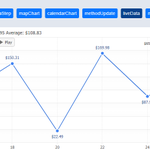
What's New in JSCharting v3.4 📊
Highlights 👓
- Organizational vertical leaf point layout
- New widgets component
- Slope, dumbbell, and waffle charts
- Labeling improvements
- And more
#javascript #DataVisualization #DataAnalytics
jscharting.com/blog/whatsnew…

What's New in JSCharting v3.3 📈
Some highlights 👓
- Widgets for dashboards
- Gantt critical path support
- Hierarchy connector styling & live API
- Dynamic gradients
- And much more
#javascript #DataVisualization #DataAnalytics
jscharting.com/blog/whatsnew…


What's New in JSCharting 3.1 📊
Some highlights:
- Automatic Column Rounding
- 26 New Examples
- Styled Line Legend Icons
- Much more...
#javascript #DataVisualization #DataAnalytics
jscharting.com/blog/whatsnew…

Participate in our Venn and Euler Diagram Challenge and win a JSCharting license" #JavaScript #dataviz
jscharting.com/blog/venn-and…
What's New in JSCharting 3.0 📈
Some highlights:
- Venn chart type
- Interactive data highlighting
- RTL text support
- 50+ Tuned Examples
- Chart wide performance improvements
- Much much more..
#javascript #DataVisualization #DataAnalytics
jscharting.com/blog/whatsnew…
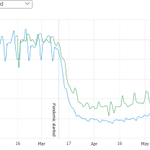
A "Hans Rosling" style animated exploration of coronavirus over time #COVID19 #DataVisualization #javascript jscharting.com/examples/char…
iOS vs Android COVID-19 Mobility Visualized #COVID19 #ios #android #javascript
jscharting.com/covid-mobilit…
"COVID-19 Dashboard with Animated Time Series, Interactive Summary and Country Comparisons" by @jscharting #DEVcommunity dev.to/jscharting/covid-19-d…
dev.to/jscharting/charts-for…
Charts for Charity: Purchase a JSCharting 8 in 1 bundle at the price you choose with all proceeds @TheRyansWell to drill wells, improve sanitation, and fund education.
#charity #dataviz #JavaScript #DEVcommunity
"5 Best Front-end JavaScript Frameworks: Multi-Year Developer Surveys Visualized" by @jscharting #DEVcommunity dev.to/jscharting/5-best-fro…
Official JSCharting plugin for @vuejs Released 💥
We built on a high quality npm package to enable beautiful interactive charts in your Vue.js applications.
Check it out here:
github.com/jscharting/jschar…
Let us know what you think!
#javascript #dataviz #charts #FrontEnd

Official JSCharting wrapper for @reactjs Released 💥
github.com/jscharting/jschar…
#reactjs #javascript #jscharting #frontend

jscharting.com/blog/best-jav…
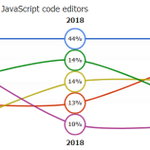
The top 5 JavaScript Editors account for 98% of usage according to the latest StateOfJS survey. Here are the top 5 editors and their trends charted.

Australian Wildfire Timeline Map and How to Donate!
Watch Australia wildfire alerts progress from Oct 2019 to Jan 2020 through an animated timeline map.
#AustraliaOnFire #JavaScript #JSCharting #DataVisualisation
jscharting.com/blog/javascri…
How to make your first JavaScript chart with JSCharting
freecodecamp.org/news/how-to…
