KUANYSH 𐰌 (@masagget) profile picture
Aral Sea
Joined July 2013
Photo by KUANYSH 𐰌 (@masagget)Photo by KUANYSH 𐰌 (@masagget)Photo by KUANYSH 𐰌 (@masagget)Photo by KUANYSH 𐰌 (@masagget)Photo by KUANYSH 𐰌 (@masagget)Photo by KUANYSH 𐰌 (@masagget)Photo by KUANYSH 𐰌 (@masagget)Photo by KUANYSH 𐰌 (@masagget)Photo by KUANYSH 𐰌 (@masagget)Photo by KUANYSH 𐰌 (@masagget)
Age structure of Kazakhstan’s ethnic groups (2021 census)
7
11
3
294
114,102
The youngest ethnic group is the Dungans (median age 21 years), followed by Tajiks (25 years), Uzbeks (26 years), and Kazakhs and Turks (both 27 years).
3
1
3
52
13,762
The 2021 boom happened because massive socio-economic stimulus and lockdowns pushed families to have babies that otherwise wouldn't exist. Without that, we’d see a smooth, gradual decline instead of a cliff dive, but tens of thousands would never have been born.
Kazakhstan TFR 🇰🇿 2021 3.32 2022 3.05 2023 2.96 2024 2.8 2025 2.53 2026 2.27 Muslims across the world are following same trajectory ☪️ Older women -> 3-5 kids (highly conservative) Younger women -> 0-1 kid (going full woke)
14
8
1
157
11,550
Monthly live births in Kazakhstan, 1987–2026
1
26
1,631
🇲🇳Mongolia 2025 Intercensal Census: Total: 3.59M (+8.9% vs. 2020) By ethnicity: Khalkh: 2.83M (83.4% of total pop, -0.4% share, +6.2% pop growth) Urbanization: 74.5% Kazakhs: 129.7k (3.8% of total pop, 0.0% share change, +7.2% pop growth) Urban: 44.8% 1212.mn/uploads/178877935109…
3
2
70
3,806
Mongolia's MICS 2023 (SISS) data is out! 🇲🇳 Key fertility insights: Total Fertility Rate (TFR): 3.3 overall Urban 3.3 | Rural 3.6 By Ethnicity: Khalkh 3.2 | Kazakh 4.8 By Wealth: Poorest 4.1 | Richest 2.8 mics.unicef.org/sites/mics/f…
7
7
6
92
22,380
KUANYSH 𐰌 retweeted
Almost half of Russia’s regions(40 out of 85)have a total fertility rate (TFR) below 1.3 children. A rate below 1.50 is observed in 72 regions, or 85% of all constituent entities. 8 fall short of the 1.70 level; only 5сhave recorded a TFR above 1.7. Only Tuva and Chechnya >2.08
12
27
8
280
28,521
Kazakhstan ends universal baby benefits Starting Jan 1, 2027, KZ will stop paying baby bonuses and childcare support to well-off families. If a low-income family’s earnings rise later, remaining payouts will stop, but they'll restart if income drops. qrnews.kz/en/news/kazakhstan…
2
1
58
2,900
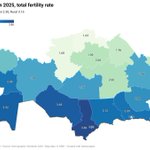
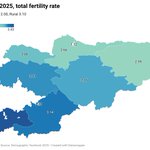
Total Fertility Rates in Central Asia by Region, 2025
4
9
7
157
38,223
Kyrgyzstan has released official 2025 data: the Total Fertility Rate (TFR) reached 2.58, down from 2.60 in 2024. The country recorded 140,504 births, a 0.06% increase from 140,419 in 2024. The capital city of Bishkek recorded a TFR of 1.32.
8
17
218
14,101
Interethnic Marriages in Kazakhstan
1
27
2,878
Vital Statistics by Ethnicity in Kazakhstan
5
4
58
5,468
Demographic Yearbook of Kazakhstan 2026 stat.gov.kz/upload/iblock/4a…
4
2,407
Orphans in Kazakhstan by ethnicity (2015–2025): Total fell 51.8% from 8,066 to 3,884. In 2025: 54% boys, 46% girls. 2025: 2,170 Russian, 981 Kazakh, and 733 other children. bala.stat.gov.kz/en/harakter…
🤖 Made with AI
2
37
3,727
Kazakhstan Ethnic Demographics (H1 2026)
1
4
65
4,081
North Kazakhstan is the least Kazakh region (~37% Kazakh, ~44% Russian), but H1 2026 births show a sharp shift: Kazakh: 47.8% (1,010/2,114) Russian: 36.2% (765/2,114) Mixed fathers: 5.0% for KZ vs 33.1% for RU mothers. Mono-ethnic KZ births (960) exceed total RU births (765)
12
16
2
199
67,878
Even combined, all Slavic & German births (RU+UA+BY+DE+PL = 983) fall short of Kazakh births (1,010).
1
2
1
46
4,976
Net Migration in Kazakhstan by Ethnicity (H1 2026) While ethnic Kazakhs and Central Asian groups drive Kazakhstan’s positive net migration, Russian net migration turned positive after decades of outflow. Only ethnic Germans and Poles remain negative.
5
5
63
5,055
Kazakhstan Births by Mother's Ethnicity, H1 2026 vs H1 2025 149,774 births were recorded in H1 2026, down 7.11% from 161,237 in H1 2025. Births by mother's ethnicity + share with a different-ethnicity father. Kazakh share of births: 79.4% in H1 2026 vs 80.0% in H1 2025.
8
11
1
91
5,560
Kazakhstan: Natural Increase by Ethnicity, H1 2026
1
2
1
19
1,608