

Market Data via AI, API, and more
Atlanta, GA
Joined January 2017
- Tweets579
- Following368
- Followers4K
- Likes564



Massive retweeted

Portfolio: down 📉
Hands: up 🙌

This developer built a roller coaster simulator that rides on price charts using Massive and Opus 5.5.
Here we are showing $TSLA, but you can ride custom charts, plus historical ones like $GME mania and the COVID crash.
Check it out here: robertcreative.com/coaster
Great work as always @Whats_Up_Rob.
Try Massive with your free API key today:
massive.com/pricing?utm_sour…

Massive retweeted

Many thanks for the kind words @JNandezPoker 🤍
I’ll answer as one description to avoid overlap.
As part of the original backtesting and modelling work, I used data from @massive_com and walked forward using only the market cap and D$V with the eligible tickers dynamically selected so that delisting, acquisitions, mergers etc were included.
The work was then repeated using the current universe for comparison, which does carry survivorship bias.
However, while not negligible, the trades related to these stocks did not materially change the model.
For example, I would need to be either:
i) in the trade when the acquisition, merger, delisting occurred and or close enough to the event that it impacted the stock price or
ii) the trade was completed outside of those events and fell within the normal range of all other trades.
The chart line is a simulation with capacity constrained, not live fills. It is the current rule set run back over the whole period using @massive_com data, walked forward day by day with the eligible universe filtered on market cap ($1B+) and dollar volume, so each day only sees what was known that day.
It is capacity constrained with no leverage: 2% per position, max 50 positions. Every eligible trade (buys, adds, trims, sells) is captured, then a Monte Carlo randomizes which trades get taken when capital is full, over hundreds of runs, to give the P10 and P90 trader (the unlucky and lucky versions). It has also been tested with a ranking layer deciding which trades to take when capital is constrained.
On in-sample vs out-of-sample: the current rules were mostly finalized before the start of 2026 however any areas of improvement and new rules are always incorporated after verification and modelling with new backtests.
It was always intended that the "model" is the best version of the algorithm at that point in time in conjunction with perfect execution of by the trader.
This will always be the most important "slippage" and the goal is to strive towards full alignment and automation to minimize that slippage.
Since January 2026 the signals have been traded live with part of the capital, selected manually and sized at 1% per position, executed into the close to match the model. Full API automation is in beta until year end, with confirmation required before each order.
With respects to costs, using modern low-cost brokers the fees are zero on common stocks. Speaking in real terms the fees on the model trades, they were 0.002%.
For slippage, I find this to be an over-blown consideration when you are trading only liquid names with $1B+ market cap stocks and D$V of $50M+.
The orders are placed as limit or "buy on close" orders to the broker via API and automatically update/feedback/revised every few seconds based on the last trade price. Some orders are filled a few cents above the close and some are a few cents below the close. They tend to net out on balance.
Finally, there are two presentations of the algorithm at present:
1) The simulation/model that walked forward capacity constraints from a particular start point simulating perfect execution. The positions that model holds can depend on the current market conditions in a sense that if there were too many opportunities it may have "skipped" some trades as it was allocated fully when the signals occurred.
2) The all open-trades without capacity constraints showing the currently eligible buys and the holdings.
During bear markets, the positions of the two views will align fully but during bull markets, the "all open-trades' view will have more positions than the model/simulation.
There is also this view of the same model (pic 1).
I asked Claude to reconcile the two views (see pic 2).
The TradingView version is a new development as I thought it might prove instructive.


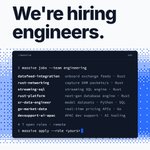
Massive is looking to hire world class engineers.
If the following roles would be a fit for you or anyone in your network,
- Datafeed Integration Engineer
- Go Engineer - Market Data
- Rust Engineer - Networking Centric
- Rust Engineer - Foundational Platform
- Senior Data Engineer II, Product Engineering
- Software Engineer, Streaming SQL
Apply here: massive.com/careers

Build something Massive.
Full tutorial here: massive.com/blog/build-a-sto…

This developer built a city visualizing sectors of the S&P 500 using Massive.
This is insane.
Everything from the lights, the weather, to the heights of the buildings come from live market data.
Here is how to read it:
Buildings: Each tower is one of the 18 largest S&P 500 stocks in its GICS sector. Height follows the square root of market cap.
Windows: Lit windows show how the stock is doing today. A dark tower is down, a fully lit one is up.
Tower: The large tower in the open plaza is SPY, the whole market. Its crown glows with SPY's move, and the LED bands scroll up or down with it.
Weather: The sky drifts from dusk at the open to night at the close. It warms when SPY is up and goes cold when SPY is down.
Traffic: More cars appear relative to SPY volume against its 20-day minute average.
Fireworks: Launch when a stock crosses another +5%, a sector another +2.5%, or SPY another +2%.
Music: Tempo is traffic, hi-hats and swing are volatility, the key is SPY direction, the bass filter opens with the size of SPY's move, and the arpeggio steps through the 11 sectors.
Check out the demo here: robertcreative.com/city
Build something Massive.

We're hiring a Head of SEO, AEO & GEO at Massive.
Help shape how developers, traders, and financial firms discover market data across search and AI.
Come build with us.
massive.com/careers/position…

Massive retweeted

Options trading is still painfully manual.
Watching charts on TradingView. Scanning options chains. Setting price alerts. Managing exits.
Today, we're launching Options Trading on Conviction.
What if trading options was as simple as describing your strategy? Conviction turns your idea into a trading agent that monitors the market, selects contracts, and executes when your conditions are met.
Link in comments.

Better data helps you build better financial applications.
Love this @0rdlibrary🤝

I have begun to integrate @Backpack x @massive_com into my paper trading platform.
I have also begun to integrate @LaunchOnSF
Paper stonks, Paper RWAs, Paper DEX.
Paper everything.

Massive is hiring.
The team is expanding across engineering, data infrastructure, developer support, and sales as we continue to grow. See open roles below:
Engineering
- Datafeed Integration Engineer
- Go Engineer, Market Data
- Rust Engineer, Networking Centric
- Rust Engineer, Foundational Platform
- Senior Data Engineer II, Product Engineering
- Software Engineer, Streaming SQL
Product and data
- Corporate Actions & Data Quality Lead
- Principal Financial Data Ontologist & Taxonomy Architect
Developer support
- Developer Support Engineer
- Developer Support Engineer, AI (APAC)
Sales
- Inbound Sales Representative
Apply here: massive.com/careers?utm_sour…


Massive retweeted

A little experiment: visualizing the market as a live city.
Each district is a sector and each tower is one of its biggest S&P 500 stocks. Lit windows show how a stock is doing. Weather volatility, Traffic is volume. Fireworks for gains.
robertcreative.com/city
Massive retweeted

Using @massive_com's data through an AI agent, "you can get answers instantaneously that you need to make a trade decision."
Each answer is paid for through x402, and "every request is only a cent." — Stevie Palmateer
Massive retweeted

Last night’s stream was really dope.
Caught this live with our new @openmarket_xyz charting
As well as @massive_com mcp data flowing.
Your agents with CUA are going to love this site.
It’s built for them, using WebMCP for web 3!
Musebook.trade/markets
