
Transport. Data. city blender.
London
Joined July 2019
- Tweets33
- Following338
- Followers81
- Likes29




Using the pandemic and lockdown periods, how can we leverage existing data to better understand the public transport needs of senior citizens?
How does this relate to public transport accessibility? #accessibility #mobility #publictransport doi.org/10.3389/fdata.2022.8…

2
Just seen @DrMalcolmMorgan tweet - pretty much the same as that technique. Would be great if someone had one from the original transxchange routelink mapping coordinates/info, then it includes some road curve info, can also group by routes that take the same path AND service ID.
Stop to stop or proper transxchange routelink/mapping shape?
After extracting a linebyline format from the transxchange data.
github.com/aclong/transx_to_…
I wrote an r script that does the stop to stop version (can dig out route shape extraction).
1
Excited to present tomorrow at this RGS Webinar with @DataDayLiving My talk will be on #mobility #accessibility #publictransport #socialexclusion. Great to be presenting work from the last couple of years of research. Thanks to @TransportForWM for data/funding/support (and @ESRC)

RGS-IBG GIScience Webinar this Wednesday 1PM UTC/GMT 📅⏰• @DataDayLiving and @mobility_data on "Accessibility and mobility in time of covid-19" 🚆🚲 • Registration: eventbrite.co.uk/e/rgs-ibg-g… #royalgiscience
Alfie Long retweeted

RGS-IBG GIScience Webinar this Wednesday 1PM UTC/GMT 📅⏰• @DataDayLiving and @mobility_data on "Accessibility and mobility in time of covid-19" 🚆🚲 • Registration: eventbrite.co.uk/e/rgs-ibg-g… #royalgiscience
Alfie Long retweeted
RGS-IBG GIScience Webinar 🚨💻• @DataDayLiving and @mobility_data will talk on "Accessibility and mobility in time of covid-19" 🚆🚲 • Wednesday 9 February 2022, 1PM UTC/GMT 📅⏰ • Registration: eventbrite.co.uk/e/rgs-ibg-g… #royalgiscience
@GISRUK Is it still possible to register to attend GISRUK? The eventbrite registration has expired? (realise I am very late)
Now with labels and highlighted areas

ALT basemap of west midlands with local authority boundaries and some areas within highlighted
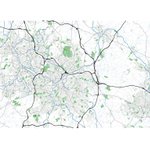
Making basemaps of the West Midlands using OS Open Data using ggplot in R. Often find chloropleth maps without reference to underlying features quite confusing. #WestMidlands #dataviz #maps @OrdnanceSurvey

ALT Basemap of west midlands using OS open data of rivers, waterways, greenspace, and roads. Contains OS data © Crown copyright 2021
1
5
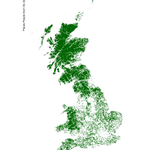
places people don't go (by public transport) using public transport stops database. Every 2km by 2km cell without a public transport stop is coloured green.

1
haha. FM was just feeling a bit similar to the day job of data analysis and replying to emails last week.
1
Does it make sense to map temporal/spatial pattern data using polar charts over space? (Like this but imagine all the pie charts are polar/nightingale charts) #dataviz (chart from here: bit.ly/3pl9PsI )

ALT A Continuously variable proportional circle map utilizes circles to portray the size of the value point. A circle will be proportional to the size of the data for a specific variable. Information can be given within the circle as a pie chart. from http://katieschoettler.blogspot.com/2010/04/continuously-variable-proportional.html
1
1
Public version of a mobility dashboard I'm working on. Only 2015/2016 data on there at the moment - concessionary travel on buses in #WMCA. Updating with 2015-2020 data in the new year. plz use and find errors julie.geog.ucl.ac.uk/tfwm_pu… #dataviz #TfWM Code: github.com/ESRC-CDRC/ihm_das…

ALT screenshot of the dashboard functioning showing travel flows from a given area with specified date
Both relating to US presidents/presidential elections
youtu.be/OFiPCen_Z3Q
youtu.be/xSOp507HJMA
Ah. Ok, maybe it was a more casual visit on your part. I think I had just been there to see an exhibition of some of Tarkovsky's personal/holiday photos in the basement.
@jayforeman I bumped into you on Store St a while ago and said "i enjoy your videos" or sthing equally inane. After watching thttps://youtu.be/_T_0FYHn0I0 I realise you must have been filming the London model at the building centre. Shame the interactive lighting wasn't working!
1
Cool. How is the GTFS generated? Is that how it is provided by the transport co. or do you convert the Transxchange version into GTFS? If so, what do you use for the conversion? Is it open source?
1