extremely irresponsible to release a tool like this without providing any information on its false positive rate
how many students will be falsely accused of plagiarism because their educator used GPTZeroX and believed it would "Detect AI Plagiarism. Accurately" as it claims?
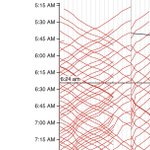
mbtaviz.github.io is an outstanding collection of interactive public transit data visualizations
spatial maps, heatmaps, line charts, bar charts, horizon charts, and scatterplots β the gang's all here, each with only a slight touch of aggregation
great work @msb5014 π

ALT Two visualizations of public transit data in Boston. On the left is a subway map with each individual vehicle marked by a dot and colored red, blue, or yellow depending on which transit line a vehicle belongs to. On the right shows time ascending downward on the y-axis and station on the x-axis. This leads to diagonally sloping lines down and to the right for vehicles moving in one direction, and diagonally sloping lines down and to the left for vehicles moving in the opposite direction. In total, the two visualizations communicate how frequently vehicles run in each transit line and how quickly they move from one station to the next, and where they may be unexpected slow downs and delays throughout the day.
Most useful thing ever, spend hours on this understanding space-time graphs and headway management
mbtaviz.github.io/
opened a linear algebra textbook from my undergrad days and surprised how few pictures there are, beyond the obligatory "vector addition parallelogram"
why isn't visualization more widely used in pure math textbooks?
R users, what is your favorite package that interacts with a web API?
Iβm making an R package for the Discogs API and have so far relied on spotifyr as a source of design inspiration, could use a few more high-quality examples like it to draw from
#rstats
when someone tells you that data cleaning has a "job relevance" of "4.0% of all DS jobs" that's a dead giveaway they have no clue what they're talking about
aspiring data scientists: ignore garbage like this
TOP 10 Data science techniques you must learn to succeed in your data science careerπ₯ππ
A π§΅β
12
tell me you don't use the terminal without telling me you don't use the terminal
This quoted post is unavailable.
10
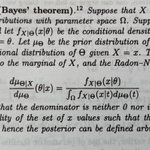
think you know Bayesβ theorem?
stumbled upon this formulation in Schervishβs Theory of Statistics, and, uhhh
data science advice that i continue to have to relearn:
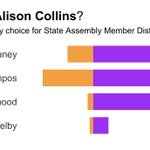
assume any plot you make will be shared far beyond the email / report / slide deck in which it originates
does the plot include all the appropriate context for a newcomer to interpret its message correctly?
"today, life won" β bullshit, thousands of pregnant women will die preventable deaths because they no longer have access to safe and legal abortions
1
6
so many medium posts on towards data science end before they actually get interesting
you gotta do more than copy and paste the "getting started" section of a project readme and add a terrible stock photo on top, cmon
4
22
I'm quoted in this article as saying that DS bootcamps are a waste of time and the author goes on to list their favorite DS bootcamps? Strange.
I'm with Rami here: learn from the community, make something, and share it with others. That's it.
You don't need certifications.
This Post is from a suspended account. Learn more
Replying to @ogiychook
@ogiychook ggbraid v0.2.2 is now on CRAN π cran.r-project.org/web/packaβ¦
1
1
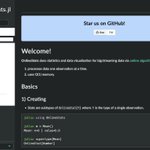
I have, yet again, bought a domain name for a new project before making any meaningful progress on the project itself
how grimly predictable
When I finished my grad stats program in 2017, I had no idea how to use a database.
I had to teach myself, but nearly everything I found online was written for business people whose Excel spreadsheets got too big.
It's been 5 years. Where do you point a data person today?