

Home of "Mr Breakouts". Algo Breakout Trading Specialists. Tips and strategies on algorithmic breakout trading. Disclaimer: https://xitter.cf/t.co/G4wi1ZckMa
Joined April 2018
- Tweets3.6K
- Following11
- Followers7.9K
- Likes1.1K




Pinned Tweet
One condition. No indicator. No parameter to optimize. It filtered 80% of bad trades from a NASDAQ breakout strategy.
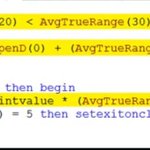
The condition: is the high of the entry bar above today's open?
That's it. One line of code.
If yes, the market has been trading above today's open. There's an established uptrend for the day. Enter the long breakout.
If no, the market is below today's open when your signal fires. You're not in an uptrend. You're trading noise. Skip.
Before:
- Net profit/drawdown ratio: 5.24
- Drawdown: ~$40,000
- Average trade: $120
After:
- Net profit/drawdown ratio: 7.97
- Drawdown: ~$25,000
- Average trade: $162
Net profit went up while drawdown got cut. That's the signature of a genuine filter. It's removing the right trades, not random ones.
Why does it work? Breakout trading is about momentum. If you're buying a breakout to the upside but the market has been trading below its open all day, there's a contradiction. The price level is breaking out, but the day's direction says otherwise. Those trades are the ones that chop you up.
No parameters means no overfitting. This is pure trading logic. You could test it on any long breakout strategy, on any market, in minutes.
The power isn't in complexity. It's in asking the right question.
What's the simplest filter you've ever used?

I ran 16.5 million filter tests on NASDAQ.
One condition beat every other oscillator, trend indicator, volatility filter, and volume condition.
The winner: a simple CCI correction filter.
Exact rule for long entries:
Lowest(CCI(27), 18 bars) < –100
In plain English:
Only take the long breakout if, somewhere in the last 18 bars, CCI(27) dipped below –100.
(i.e. the market has already had a real correction)
Results across 1,000 strategy variations:
> Net profit improved on 69% of strategies
> Average trade improved by 22% on more than half
> Bounce index: 57.8% (turned that many losing variations profitable)
On the base NASDAQ breakout:
> Profit/drawdown ratio: 7.53 → 8.6
> Average trade: $116 → $149
Breakouts taken after a genuine washout have room to run.
Breakouts taken into already-extended strength tend to fade.
This wasn’t tested on one strategy.
It was stress-tested across 1,000 different ones.

If you want more filter approaches like this one, the Indicators Playbook covers the indicators and conditions that actually improved results across large-scale tests, with real settings and code.
go-bta.com/indicators-playbo…

Breakout Trading Academy retweeted
They told us to avoid low ADX.
Turns out... that's exactly where the real edge hides.
📉 SHORTS → ADX > 30 = confirmation
📈 LONGS → low ADX = real edge
Low ADX signals coiled volatility.
It’s not chop. It's a buildup.
So we built our model breakout strategy using:
• Volatility = open–low difference
• Breakout level = low + (3.3 × volatility)
• Stop entries only
• Entry filter: 8am–3pm
• Exit: when ADX > 40 or after time limit
This flip gave us a consistent edge in markets most traders avoid.
Full breakdown + free resource in the comments

Breakout Trading Academy retweeted
I ran 16.5 million filter tests on NASDAQ.
One condition beat every other oscillator, trend indicator, volatility filter, and volume condition.
The winner: a simple CCI correction filter.
Exact rule for long entries:
Lowest(CCI(27), 18 bars) < –100
In plain English:
Only take the long breakout if, somewhere in the last 18 bars, CCI(27) dipped below –100.
(i.e. the market has already had a real correction)
Results across 1,000 strategy variations:
> Net profit improved on 69% of strategies
> Average trade improved by 22% on more than half
> Bounce index: 57.8% (turned that many losing variations profitable)
On the base NASDAQ breakout:
> Profit/drawdown ratio: 7.53 → 8.6
> Average trade: $116 → $149
Breakouts taken after a genuine washout have room to run.
Breakouts taken into already-extended strength tend to fade.
This wasn’t tested on one strategy.
It was stress-tested across 1,000 different ones.
Exact condition and full results:
breakoutos.com/blog/nasdaq-1…

Breakout Trading Academy retweeted
“Why have my trading strategies suddenly stopped working?”
It’s not just you.
More traders than ever - from beginners to seasoned pros - are scratching their heads, wondering the same thing. And even the giants are stumbling.
Take Man Group:
➡️One of the world’s biggest hedge funds
➡️Their stock is down nearly 30% in the past 12 months
➡️Analysts are pointing fingers at underperforming computer-driven (quant) strategies
So, if firms with billions in research and supercomputers can’t adapt, it’s no surprise individual traders are struggling too.
The truth?
🛑Much of the old trading game is over
🛑AI isn’t just “helping” the markets - it’s reshaping them
🛑Traders who don’t adapt to this new AI Era will stay stuck, confused, and left behind
That’s exactly what I cover in my new video series “The AI Shockwave Hitting Traders Right Now…”
Once you see what’s really happening, you’ll understand how to trade smarter, while others are still clinging to outdated playbooks.
Sign up for the free video series today, link in the comments.

Breakout Trading Academy retweeted
I tested 1,725 advanced moving average breakout strategies on E-mini Nasdaq (60-minute).
Not regular moving averages. Midpoint and median averages that measure price equilibrium.
The setup:
- Point of initiation: advanced midpoint or median
- Space: ATR (5, 20, or 40) multiplied by a fraction
- Exit: end of day
- 23 different points of initiation × 3 ATR periods × 25 fractions = 1,725 tests
Midpoint period 15 came out on top. It worked across the vast majority of the tested samples and produced better out-of-sample scores than in-sample.
One detailed example: MidPoint(15) + 0.4 × ATR(5) Robustness suite score: 81 (in-sample 68, out-of-sample 86)
Advanced averages worked very well as a foundational breakout model, at least on this market and timeframe.

Breakout Trading Academy retweeted
I’ve built over 2,500 trading strategies at my hedge fund and only one has earned the title “risk-free.”
Not because it’s magic.
Not because it’s perfect.
But because it’s built on a logic filter with zero optimizations.
No adjustable inputs.
No overfitting risk.
Just pure breakout trading, stripped to the bone.
It works across ES, YM, S&P 400, without tweaking a single thing.
Here’s the result. 👇

I tested 1,725 advanced moving average breakout strategies on E-mini Nasdaq (60-minute).
Not regular moving averages. Midpoint and median averages that measure price equilibrium.
The setup:
- Point of initiation: advanced midpoint or median
- Space: ATR (5, 20, or 40) multiplied by a fraction
- Exit: end of day
- 23 different points of initiation × 3 ATR periods × 25 fractions = 1,725 tests
Midpoint period 15 came out on top. It worked across the vast majority of the tested samples and produced better out-of-sample scores than in-sample.
One detailed example: MidPoint(15) + 0.4 × ATR(5) Robustness suite score: 81 (in-sample 68, out-of-sample 86)
Advanced averages worked very well as a foundational breakout model, at least on this market and timeframe.
Moving averages are just one piece of the puzzle. Choosing the right indicators and knowing how to use them can make a big difference.
If you want to explore more, check out our Indicators Playbook here 👇
go-bta.com/indicators-playbo…
Explore more breakout strategy research: go-bta.com/advanced-ma-break…
Breakout Trading Academy retweeted
The best filter on index breakouts wasn’t an oscillator.
It was bar range relative to ATR.
That’s high minus low compared to recent average true range.
Across 3,500 NASDAQ strategies it delivered:
- Max drawdown cut by 40%
- Net profit improved by 60%
- Highest robustness index of any filter in the test
Volume and moving averages also showed positive uplift in-sample and out-of-sample.
Oscillators made results worse.
Complex filters overfit.
Simple volatility structure travels.
One well-tested filter beats a stack of optimized ones.

Breakout Trading Academy retweeted
What’s the edge smart traders build?
Nikkei opens while most of the West sleeps and it’s handing out $100+ breakout trades with ease.
✅ Easy to access via CME
✅ Works great with my breakout formula
✅ Loves the same ADX settings I use for US indexes
Most algo traders are glued to Nasdaq.
You don’t have to be.
See the result below and watch how I built a Nikkei strategy from scratch in the comments. ⬇️

Breakout Trading Academy retweeted
How much can you realistically make with breakout day trading?
Using Breakout Radar on E-mini Nasdaq (60-minute), the theoretical maximum if you captured every main swing is close to $11,000 per day with one contract.
That is completely unrealistic.
A more realistic path looks like this:
Discretionary trading
- Traders usually aim for about a quarter of the movements
- After accounting for winners and losers, modeled efficiency is around 10%
- Roughly $1,000 per day or $22,000 per month on average (one contract)
Algorithmic trading
- Computers miss the market sense a discretionary trader develops
- Rule of thumb is about half that efficiency (~5%)
- Roughly $500 per day or $10,000–$11,000 per month on average (one contract)
These are averages. There will still be losing days, losing months, and drawdowns.
You do not need to catch the entire move. Getting into the momentum after a meaningful break and exiting well is often enough.
Micro Nasdaq is one-tenth of these numbers.

The best filter on index breakouts wasn’t an oscillator.
It was bar range relative to ATR.
That’s high minus low compared to recent average true range.
Across 3,500 NASDAQ strategies it delivered:
- Max drawdown cut by 40%
- Net profit improved by 60%
- Highest robustness index of any filter in the test
Volume and moving averages also showed positive uplift in-sample and out-of-sample.
Oscillators made results worse.
Complex filters overfit.
Simple volatility structure travels.
One well-tested filter beats a stack of optimized ones.
Full results and rankings:
breakoutos.com/blog/best-tra…
How much can you realistically make with breakout day trading?
Using Breakout Radar on E-mini Nasdaq (60-minute), the theoretical maximum if you captured every main swing is close to $11,000 per day with one contract.
That is completely unrealistic.
A more realistic path looks like this:
Discretionary trading
- Traders usually aim for about a quarter of the movements
- After accounting for winners and losers, modeled efficiency is around 10%
- Roughly $1,000 per day or $22,000 per month on average (one contract)
Algorithmic trading
- Computers miss the market sense a discretionary trader develops
- Rule of thumb is about half that efficiency (~5%)
- Roughly $500 per day or $10,000–$11,000 per month on average (one contract)
These are averages. There will still be losing days, losing months, and drawdowns.
You do not need to catch the entire move. Getting into the momentum after a meaningful break and exiting well is often enough.
Micro Nasdaq is one-tenth of these numbers.
Full breakdown of the estimates and assumptions:
breakouttradingacademy.com/c…
BreakoutOS (Breakout Radar is inside it):
breakoutos.com