
Hi guy's We track opendoor data.
Taiwan
Joined March 2022
- Tweets771
- Following26
- Followers2.5K
- Likes282


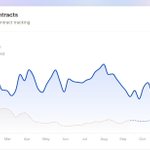




提供一個自己觀察 $OPEN 的指標
Kaz曾經說過,如果要損益兩平,
大約每月要賣出2000間房屋
當你看到Pending的房屋接近2000時
會是不錯的投資機會
因為這個月的pending
將會是下個月的sold
免費分享給大家
docs.google.com/spreadsheets…


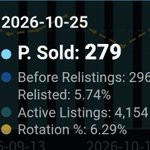
Comparing P. Sold directly between the current week (10/25) and last week (10/18) creates a misleading conclusion due to lagging relist data.


Both cohorts started with virtually identical contract volumes before relistings (296 vs 294). The difference in current P. Sold (279 vs 249) is simply because 10/18 has had an extra week to realize fallen-through deals (15.31% relisted vs 5.74% for 10/25).


Quick reminder: I’ve been tracking Opendoor data since before 2022.
Back then, Datadoor ripped off my idea and charged investors $40/month for it.
Today, Datadoor is gone (the founder got margin called after an earnings print).
I’m still here.


