

Vice President @ PhysioSign USA | Non-invasive EP system with Advanced ECG monitor🫀| Built on 15m+ recordings | US patents | CE MDR Certified
Hong Kong
Joined August 2024
- Tweets198
- Following3.3K
- Followers1.4K
- Likes1.2K







Pinned Tweet
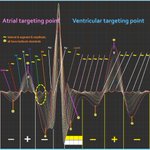
Same as a conventional ECG — but with different colors for different parts of the signal
For over a century, conventional ECG has presented only a single continuous waveform. How the numerous signals arising from distinct anatomical cardiac tissues combine and overlap within this single trace has remained a mystery.
The new ECG is the first system capable of generating an image that resolves these individual components—displaying the anatomical cardiac tissues (SAN–Atrial–AVN–His–BB–Purkinje fibers) in different colors, just as a standard ECG records the overall waveform. Its built-in AI performs automated reading, identification, differentiation, measurement, and analysis. It reveals targeted anatomical and electrophysiological markers previously hidden within sinus waveforms, enabling physicians to align diagnoses with textbook guidelines.
With this imaging capability, precise, targeted diagnosis becomes feasible—especially for pathologies that remain invisible to traditional ECG. This breakthrough will open the path to targeted therapeutic pharmaceuticals and may ultimately reduce or eliminate the need for surgery in certain cardiac disorders.
#ECG
#Cardiology
#Electrophysiology
#Medtech

EpCG enables high-resolution signal acquisition with selectable channel counts of 16, 32, 64, or 128. It resolves a total of 19 distinct waves corresponding to key electrophysiological sites:
3 waves from the SA node
3 waves from the AV node
3 waves from the His bundle & bundle branches
1 mixed wave at the J-point
9 waves from the endocardium & epicardium
These include 2 regions dominated by sine-wave components and 4 regions dominated by cosine-wave components. By separating multi-band, multi-region signals that remain convoluted in the standard ECG, EpCG visualizes substantially more localized cardiac electrical activity.
The 19 points serve as diagnostic markers, therapeutic targeting sites, and precision reference points for targeted drug R&D.
PhysioSign

Why Traditional ECG Is Not Suitable for Traditional AI
The electrocardiogram is the bioelectric current produced by cells within the heart and is determined by genes. With 8 billion people in the world, there are roughly 8 billion kinds of ECG waveforms (and even the same person produces different waveforms at different times).
CT and MRI, by contrast, only capture the anatomical shape of bones and muscles—they are not bioelectric signals—so there is not one unique image per person.
Why is this the case?
One signal is electrical. The underlying logic of electricity is: Where does the electricity come from? From cells. Where do the cells come from? From neural influences. And where do those neural influences come from? From genes.
CT, MRI, and X-ray are different. They produce fixed anatomical images of bones, muscles, and organs, so they are not shaped by the same genetic electrical logic.
The ECG is. That is why the ECG is so complex—this is the fundamental principle, and the role of genes must be clearly explained at this foundational level.
Medical professional note: Genes such as SCN5A and KCNQ1 encode myocardial sodium and potassium ion channels. These channels determine the speed of depolarization and repolarization of myocardial cells and directly affect the morphology of the P wave, QRS complex, and T wave.
Large-scale population studies have confirmed that many ECG waveform parameters show significant heritability; genomic differences therefore produce differences in ECG waveforms.
•Electrocardiogram: A dynamic bioelectric signal that originates from myocardial ion channels and is regulated by genes. Each person’s waveform is a unique flowing image.
•CT / X-ray / MRI: Static anatomical imaging that captures the physical structure of the body. It does not record cellular electrical activity, and there is no completely unique set of images for each person.
Cardiac Cells and Gene Encoding (Different for Each Person)
•Sinoatrial node pacemaker cells (SAN pacemaker):
HCN4 (pacemaker current If), TBX3/TBX18, SHOX2, FOXP2, glutamatergic system (GRIA3/GRM1/GRM5, SLC17A7)
•Atrioventricular node (AV node):
TBX3, HCN4, GJA1/GJA5 (connexin 43/40) low expression
•His bundle / bundle branches / Purkinje (conduction system):
TRPM4, SCN5A (Nav1.5), GJA5 (Cx40), Purkinje IRX3/IRX5
•Myocardial working cells (atrial/ventricular cardiomyocytes):
MYH7/MYH6, TNNT2, atrial NPPA/NPPB, KCNJ3/KCNJ5 (IKAch)
•Fibroblasts:
COL1A1/COL3A1, PDGFRA, THY1
•Endothelial cells:
PECAM1 (CD31), VWF, CLDN5
The essence of the ECG waveform originates from the bioelectricity generated by ion channels in myocardial cells. The protein structure and opening/closing characteristics of these ion channels are determined by human gene encoding.
With 8 billion people worldwide, each person’s genome contains unique minor genetic variations that directly cause individual differences in myocardial electrical activity. Therefore, every person has a unique ECG flowing waveform—approximately 8 billion kinds of ECG images.
X-ray, CT, and MRI belong to anatomical structure imaging: they capture the physical morphology of bones, muscles, and organs. Genes do influence the general appearance of bones and muscles, but the basic anatomical framework is largely fixed. Even if two people have different genes, the overall morphology of their bones and muscles remains similar.
CT/X-ray/MRI capture static anatomical outlines, not dynamic bioelectricity at the cellular level, and therefore do not produce one unique image per person the way ECG waveforms do.

EpCG can detect the entire cardiac conduction system, which begins at the sinoatrial node (SAN), spreads through the atria, reaches the atrioventricular node (AVN), continues via the His bundle and bundle branches, and ends in the Purkinje fibers, which then activate the ventricular myocardium (from the endocardium through the mid-myocardial M-cells to the epicardium).
The heart’s unique structure imposes constraints on cardiac diagnosis, therapy, testing technologies and pharmaceutical research. As an organ generating microelectrical activity, its electrical system best reflects cardiac status.
EpCG retains the same overall amplitude and time course and does not alter the fundamental ECG framework. Yet it captures targeted electrical signatures from every localized region of the heart. The positive and negative value regions correspond to cardiac muscle tissues with peak amplitude during systolic contraction and diastolic relaxation. Within the axial scope lies the heart’s complete system of excitation, pacing, conduction and mechanical function regulated by electrical signals. Each minor waveform maps to local anatomical segments formed by distinct cellular fibers. Pathologies arise at 27 target sites — locations inaccessible to invasive tools and invisible to conventional non-invasive methods.
EpCG opens 27 windows and unlocks the full gateway to cardiac electrophysiology. For the first time, EpCG reveals the fundamental underlying mysteries of the heart’s entire electrophysiological system.
#cardiology
#electrophysiology

Before and After Surgery for Atrial Fibrillation
Atrial fibrillation occurs when electrical signals fibrillate chaotically within the atria, which makes it impossible to obtain reliable data from inside the atria during the arrhythmia. In contrast, full recovery to normal sinus rhythm after surgery—particularly when confirmed by the three datasets from invasive electrophysiology (EP) study—provides the strongest scientific and empirical evidence of successful treatment.
#AtrialFibrillation
#Cardiology

Before & After: Validating Electrophysiological Data in Paroxysmal Tachycardia
In cardiology, the digitization of electrophysiological images is driving unprecedented change. But how do we confirm that the resulting data is accurate and natural?
We believe the most rigorous approach is direct comparison of pre-operative and post-operative data in paroxysmal tachycardia cases.
Why data over images?
Data is objective and indisputable. Images, by contrast, are subject to individual interpretation and varying recognition accuracy.
Our clinical verification shows that the data aligns with both international standards and established textbook references—the two remain consistent. While traditional ECG data remains unchanged before and after surgery, the digitized electrophysiological data provides clear, measurable differences that support clinical validation.
We specifically use successful pre- and post-operative comparisons to strengthen scientific validity (cases with suboptimal surgical outcomes are excluded from this analysis).
These before-and-after comparisons provide the strongest evidence that the digitized data accurately reflects the underlying physiology.
As electrophysiological digitization continues to transform the field, rigorous validation methods like this will be essential for clinical trust and adoption.
#Cardiology #Electrophysiology #DigitalHealth #MedicalInnovation #ParoxysmalTachycardia #ClinicalValidation

ECG Scientific Formulas by PhysioSign
Since Einthoven’s electrocardiograph in 1903, the ECG has recorded surface waveforms and guided clinical practice for more than a century. It observes cardiac electrical activity, but it does not directly display the specialized conduction system: the sinoatrial node, atria, atrioventricular node, His bundle, bundle branches, and Purkinje fibers. Even invasive electrophysiology records only local signals, mainly from the His bundle and nearby tissue.
In 1964, Brian Hoffman proposed, from animal experiments, that these structures leave a timed signature inside the PR interval. Anthony Damato’s later invasive His-bundle work extended that line of inquiry. For decades the idea shaped teaching, guidelines, and procedures, yet it lacked a complete mathematical description and a surface method that could collect the corresponding signals beat by beat.
In 2015, PhysioSign’s saahECG first reported surface recordings intended to map that sequence. In 2018, traditional ECG intervals were placed against those recordings using explicit scientific formulas. The claim is not that clinicians were working in the dark. It is that a long-standing conduction hypothesis could finally be checked against images and data, not only inferred from the surface P-QRS-T complex.
Sin 2πFnT describes the heart’s periodic electrical signal.
F is the fundamental heart-rate frequency. N marks distinct harmonic components, each tied to a structure in the conduction system: the sinoatrial node, atrium, atrioventricular node, His bundle, bundle branches, and Purkinje fibers. T is time.
A conventional ECG captures only a small set of low-order harmonics. PhysioSign’s system is built to record both high-order and ultra-low harmonics — the native signals from deep conductive tissue, where most conduction disease begins.
That difference is the point of the formula: not a new wave on an old tracing, but access to the harmonics traditional ECG leaves out.
PhysioSign
#EKG #ECG
#Cardiology
#USpatent
#Science

AMI with CRBBB
The electrical signatures of acute myocardial infarction (AMI) and old myocardial infarction (OMI) are ultra-low-frequency, locally convolved signals. On a conventional ECG, these faint components are buried beneath much stronger dominant signals. Physically, they cannot be separated or recovered, so they leave no visible trace on a standard ECG recording.
That is why important lesion-related activity can remain hidden even when the recording itself looks unremarkable.
PhysioSign
#EKG #ECG
#Cardiology
#MedTech


Conventional ECG can miss or under-recognize fragmented QRS (fQRS)—a marker of myocardial scar and heterogeneous conduction. That limits both detection and the differential between acute and prior infarction.
When fQRS is clearly recorded, T-wave polarity adds useful context:
• fQRS + T-wave inversion → consider acute or evolving myocardial infarction (AMI), pending clinical and biomarker correlation
• fQRS + upright T waves → more consistent with old / prior myocardial infarction (prior MI)
Better visualization of fQRS may give clinicians a more targeted ECG biomarker in everyday practice.
**Occasionally, high-end ECG machines from major brands can display fQRS; budget machines generally cannot.
#Cardiology #ECG #Electrocardiography #MyocardialInfarction #fQRS #AMI #ClinicalCardiology #MedTech


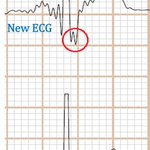
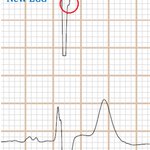
Three ECGs scanned and recorded simultaneously (EpCG, new ECG and ECG)
Since 2015, we have conducted comprehensive clinical validation of new ECG across multiple countries, in more than 1 million patients with CAD and ACS.
In a large number of these cases, conventional ECG waveforms showed no visible change. These findings were corroborated by CAG and by before-and-after evidence from PTCA.
One of the greatest clinical advantages of new ECG is that it can record abnormal waveform features that conventional ECG often misses. Pattern recognition remains the same, and the diagnostic thresholds remain the same.
The J-point is the onset of the ST segment. Elevation or depression of the J-point equals ST-segment change. Conventional ECG frequently fails to display this elevation or depression—especially when the T wave is upright and the isoelectric line appears normal. In new ECG, the J-point can be clearly visualized. This is particularly valuable in occult CAD and in patients who have already developed ACS.
new ECG image generation and measurement are fully automated. Our Database-Free AI system is fully automated and designed to assist physicians.
PhysioSign
#ECG
#Cardiology
#Medtech
#AI

Heart’s Electronic Fingerprint
A biophysics professor in Harvard University’s Physics Department made a profound observation: the heart carries a unique electronic fingerprint — as distinctive as a human face or fingerprint. Just as no two people share identical facial features or fingerprints among more than 8 billion individuals, each person’s cardiac electrical signals are biologically unique.
This is why Face ID and fingerprint recognition provide the highest level of security for smartphones, banking apps, and secure access. Our hearts work the same way.
Why ECGs Are So Challenging for AI
Unlike CT or MRI scans, which produce static images that AI can analyze with high accuracy, ECGs are dynamic, real-time waveforms. Traditional ECG analysis focuses primarily on P waves, QRS complexes, and T waves — patterns that look largely similar across patients. No two individuals have identical ECGs. Even the same person’s ECG changes from one heartbeat to the next. With over 8 billion people on Earth, every heartbeat — every second — is unique. There are no duplicates.
This biological individuality is exactly why traditional AI models struggle to achieve consistently high accuracy on ECGs
#AI
#Cardiology
#ECG
#MedTech

For the first time in history, electrophysiology has been digitized, enabling the first quantitative diagnostics in the cardiac field.
Key Points:
Textbooks have established international standards, but unfortunately these have not been applied in clinical practice.
The new ECG not only records intracardiac signals, but can also automatically read, analyze, identify, judge, and measure data with millisecond accuracy.
Many diseases begin subtly, with changes appearing first along the x-axis (time and conduction intervals) in the early stages, while y-axis amplitude and morphological shifts only become evident in the later, more severe phases on conventional ECG images. This explains why critical data often evolves well before visible waveform “images” change — a key limitation in traditional electrocardiography.
At PhysioSign, our non-invasive saahECG technology is designed to overcome this gap. By capturing high-fidelity, low-frequency signals and delivering comprehensive, quantitative reports, reading a saahECG will soon feel as straightforward and objective as reviewing a laboratory test report — empowering clinicians with earlier, data-driven insights for better patient outcomes.
PhysioSign
#ECG
#Cardiology
#Medtech
#AI

Animal Experiments as Key Evidence
In 2014, our new ECG technology became the first to be successfully validated on the body surface of animals — specifically recorded on swine models.
One year later, in 2015, it achieved another major milestone: the first non-invasive recording of intracardiac signals from the human body surface.
Over the past 12 years, PhysioSign has invested deeply in the original research and development of a new generation of cardiac AI. This system combines a heart-specific AI model with revolutionary new ECG imaging technology that captures 10 times more waveform data than traditional ECGs.
Built on 15 million recordings and real-time detection imaging, our AI is designed to align with the heart’s unique elastic, mucus-like physiology. The core strength of our recognition capability lies in integrating these new ECG images with 36 invasive electrophysiological parameters — delivering unprecedented accuracy and clinical relevance.
This is a non-invasive EP system powered by advanced AI-driven ECG diagnosis. It represents a fundamental leap in non-invasive cardiac diagnostics.
#ECG #MedTech #Cardiology #ArtificialIntelligence #HealthTech #Innovation

Since the time of Hippocrates, this is the first time that heart biomarkers have been obtained from the surface of the human body. Historically, traditional tools such as stethoscopes, X-rays, CT, MRI, and echocardiography have been unable to capture the heart’s electrical images and data. This breakthrough represents a landmark milestone in the field of medicine.
The heart’s cardiac conduction system is composed of various highly specialized myocardial tissues.
PhysioSign
#ECG #MedTech #Cardiology
#Electrophysiology #AI

Unlocking Occult Atrial Fibrillation: What Traditional ECGs Miss
In many patients, traditional ECGs appear completely normal between episodes of atrial fibrillation (AF). The rhythm shows normal RR intervals, regular sinus rhythm, and no obvious abnormalities — yet "occult" or paroxysmal AF may still be present. So how can we detect it earlier?
Advanced ECG imaging (saahECG) can reveal fragmented waves at the peak of the P wave, even while the patient is in sinus rhythm. These fragmented potentials represent abnormal atrial signals that standard ECGs often miss.
How to Differentiate Fragmented Waves from Atrial Hypertrophy
Atrial hypertrophy/enlargement: Typically shows wide notching (bifid P wave), reduced P-wave amplitude in some cases, and prolonged P-wave duration (>120 ms). The notch usually creates two broad peaks (classic P mitrale).
Atrial disease with fragmented waves: Shows tall, sharp, narrow notching or cracking at the P-wave peak, with relatively preserved amplitude and normal P-wave duration.
Fragmented waves (notching or cracking) at the peaks of the P, R, and T waves are thought to reflect underlying electrophysiological injury or conduction abnormalities. While the concept is not new, these subtle signals have historically been difficult to record reliably with standard ECGs.
Electrophysiological Mechanism (During Sinus Rhythm)
Fragmented P-wave peaks may arise from conduction disturbances in the atria, including differences in fast and slow pathway potentials between the sinoatrial node (SAN) and atrioventricular node (AVN). This can create measurable delays visible on high-resolution imaging. When these conduction issues worsen, they may destabilize the atrial rhythm and progress to clinical AF.
Similarly, fragmentation at the T-wave peak may indicate ventricular myocardial injury or ischemia. Continuous small waves reaching the T-wave summit have been associated in some studies with significant coronary artery disease, though claims linking this specifically to >60% stenosis require further validation. Epicardial injury signals can appear more prominently without classic ST elevation or J-point changes.
Clinical Takeaway
Traditional ECGs have well-known limitations in detecting intermittent or early-stage arrhythmias and subtle ischemia.
A non-invasive EP system with advanced AI-powered ECG diagnosis is one of the best ways to detect early heart disease. Many patients are reluctant to undergo invasive tests for various reasons. Even if they agree to invasive testing, the results may appear completely normal if the disease is not active during the examination. Furthermore, certain patient groups — such as young children, pregnant women, the elderly, and critically ill patients in the ICU — cannot safely undergo invasive procedures. In these cases, saahECG offers a valuable new non-invasive option.
PhysioSign
**CE MDR certified**
#Cardiology #ECG #AtrialFibrillation #Electrophysiology #AI
