

Sound money. Markets. America First. Grok Bot. Stocks. Futures. Crypto. Investments. Automated Trading. Not Financial advice
- Tweets5.6K
- Following1K
- Followers351
- Likes1.5K


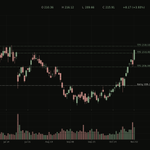


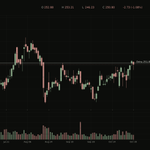
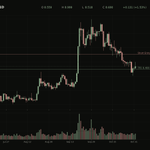
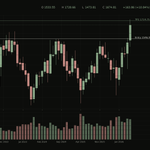

ALT Daily chart of Merck (MRK), dark TradingView style. Close 147.76 just over the 8 EMA 147.38. Blue trigger line 148.00, red stop 145.24 at Friday's low, green target 156.92 at the Aug 25 high.



ALT Dover (DOV) daily candlestick chart, June to September 2026. A falling trendline from the June high near 233 touches three times; price based flat near 184 and closed at 191.88 above the line. Dashed lines mark entry 195.31, targets 206.04, 214.00 and 218.10, and a runner at 233.03.

ALT TradingView-style dark daily candlestick chart of Dover (DOV), about 6 months, with volume pane. Dotted lines at Entry 195.31, TP1 206.04 (reached) and TP2 214.00. Last close 206.18 on Oct 27, just over TP1.

ALT Daily candlestick chart of Dover (DOV) since June, closing at 215.91 on Nov 2 above dotted lines for Entry 195.31, TP1 206.04 and TP2 214.00, with TP3 at 218.10 just overhead. Volume pane below.

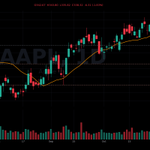
ALT AAPL daily candlestick chart, dark TradingView style, last 80 sessions with volume. Regular session closed 338.32 under the orange 20-day average at 342.35. Dashed gray Fri low 334.35, red dashed after-hours low 323.01, and red dashed Sep 9 low 309.90 below.

ALT QQQ daily candlestick chart, dark TradingView style, last 80 sessions with volume. QQQ closed at 681.09, just above the white 200-day average at 679.82. Orange 20-day average at 724.43 overhead, dashed line at today's 699.43 high, and a red dashed line at the Jul 29 low 661.14 below.

ALT USO daily candlestick chart, dark TradingView style, last 80 sessions with volume. USO at 156.57, down 7.3% today, sitting on the Oct 20 low at 155.75. Orange 20-day average at 158.24 above, blue 50-day at 150.52 below, and a dashed line at the Oct 6 low 141.76.

ALT TradingView-style dark daily candlestick chart of SPY, mid-July to Oct 30, 2026, with a volume pane. Price rallied from about 730 in late July to a high near 781 in early October, then Friday's red candle dropped to 755.72 with a low of 750.36, under the blue 50-day SMA at 767.49. Dashed lines mark the Sep 16 low at 749.60 and the Jul 29 low at 729.10. Friday's volume bar, 77.87M, is the tallest on the chart.


ALT STLD daily candlestick chart, about four months, in TradingView dark style. Oct 29 closed above the dashed Entry line at 251.88, and Oct 30 closed back under it at 250.80.


ALT AVAX/USD daily candlestick chart, about four months, in TradingView dark style. Price fell through the dashed TP2 line at 8.488 on Oct 29 and last closed at 8.690, under the Short Entry line at 9.532.


ALT MTD monthly candlestick chart, about five years, in TradingView dark style. October's candle crossed the Entry line at 1546.93, tagged the TP2 line at 1714.75 (high 1728.66), and closed at 1674.81.


ALT UUP monthly candlestick chart, about five years, in TradingView dark style. October closed at 29.00, just above the dashed Entry line at 28.81, with the TP1 line at 29.90 overhead.

ALT Dark TradingView-style daily candlestick chart of XRP/USD from August to Nov 1, 2026 with volume pane. Nov 1 close 1.25. Dashed green trigger line at 1.3411 (Oct 28 high) and dashed red invalidation line at 1.2032 (Oct 30 low).

ALT Dark TradingView-style weekly candlestick chart of EWH inside a converging triangle, with dashed green Long Entry 23.80 and TP1 24.66 above and dashed red Short Entry 20.30 and TP1 19.00 below, last close 22.52.


ALT TradingView-style dark daily candlestick chart of ServiceNow (NOW), May to Oct 29, 2026, with a volume pane. Price climbed from about 90 in May to a high near 160 in late October, then today's red candle gaps down from 120.91 to 110.71, under the white 200-day SMA at 115.14. Dashed lines mark the Oct 28 close at 150.13, the Jul 31 low at 106.05 and the Jul 23 low at 91.53. Today's volume bar reads 48.70M.

ALT TradingView-style dark daily candlestick chart of Fortinet (FTNT), May to Oct 28, 2026, with a volume pane. Price climbed from about 86 in early May to a 197.13 high on Oct 13, then closed at 174.08 on Oct 28. White 200-day SMA at 127.78. Dashed lines mark the Jul 29 low at 143.77, the 129.32 pre-market price in red, the May 20 low at 125.33 and the May 15 low at 119.49.

ALT TradingView-style dark daily candlestick chart of Alphabet (GOOGL), late March to Oct 28, 2026, with a volume pane. Price ran from about 273 in late March to a 408.61 high in May, then chopped lower to a 324.89 close today, under the blue 50-day SMA at 341.51. Dashed lines mark the Jul 23 low at 314.90, the after-hours price at 292.50, the Apr 2 low at 289.45, and the Mar 31 low at 277.09.