

I'm documenting the real-time growth of a $100,000 investment account created for my newborn son. Not Financial Advice.
Joined June 2020
- Tweets6.2K
- Following256
- Followers1.8K
- Likes17.1K




With the doomers out in full force now is the time to get your handy relative strength tool out and see what stocks did not make a lower low with the $QQQ today. Ill start $MU.
I have been defensive for the better party of 50ish days but now that we are seeing 40% $vix days its time to get bullish again.


115
When Jim Cramer starts tweeting this much in the pre market session you know vol is about to be up and we could be at a turning point
1
60
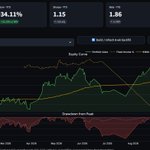
10/20/26 Portfolio Update (34.1% YTD vs SPY/IWV 12.5%)
Up nearly 3x the index and the engine is boring old PM at 7.3% — my single biggest position isn't a Mag7 name, it's a tobacco cash machine quietly outrunning half of tech.
Mag7 - 18.5%
NVDA - 6.2%
META - 5.7%
AMZN - 4.6%
TSLA - 2.0%
Financials - 11.2%
CME - 4.5%
BRK - 4.4%
SPCX - 1.4%
FICO - 0.9%
Healthcare - 11.1%
LLY - 6.0%
VRTX - 3.3%
MCK - 1.8%
Consumer Staples - 11.0%
PM - 7.3%
COST - 2.9%
CRWV - 0.8%
Fixed Income - 9.5%
IEF - 6.1%
SPHY - 3.4%
Industrials - 7.7%
WM - 5.4%
LMT - 2.2%
Energy - 7.3%
XOM - 5.2%
OXY - 2.1%
Crypto & Blockchain - 6.8%
BMNR - 4.7%
MSTR - 2.1%
Precious Metals (Gold/Silver/Miners) - 6.4%
GLD - 6.4%
Call Spread - 5.3%
PAGS (Calls) - 1.9%
STNE (Calls) - 1.9%
CRSP (Calls) - 0.4%
IBM (Calls) - 0.4%
EBAY (Calls) - 0.3%
MQ (Calls) - 0.3%
Nuclear - 2.3%
CEG - 2.3%
Long Call - 1.3%
FXY (Calls) - 0.8%
BWXT (Calls) - 0.4%
Put Spread - 0.7%
SPY (Puts) - 0.7%
Technology - 0.6%
IONQ - 0.2%
QMCO - 0.2%
RGTI - 0.1%
INFQ - 0.1%
Cash: 0.4%
The shape of this book is deliberate: I'm not all-in on the AI trade. Mag7 is my largest theme but it's balanced against real cash flow (PM, COST, XOM, WM) and nearly 16% in bonds and gold doing the quiet work of keeping me in the game when the momentum names wobble. GLD at 6.4% isn't a hedge anymore — it's a position with conviction, and it's been paying.
The real alpha this year came from refusing to chase. Boring compounders up top, asymmetric call spreads (PAGS, STNE) down the bottom doing the swinging, and a small SPY put spread so I sleep. The latam fintech calls are my highest-conviction speculative bet — cheap optionality on a group the market left for dead. If I'm wrong, it costs me basis points. If I'm right, it's a theme, not a lottery ticket.
What's the one position in here you'd size up — and what would you cut?


1
125

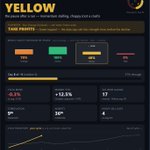
Under the hood: Day 3 of a Yellow phase that usually runs ~8 (median 6) — about 37% through. Move so far -0.3%, dead typical. Breadth confirms the pause: more new highs than lows, 58% near 52-week highs, but momentum rolling over. Crowd: stock correlation at the 9th percentile — healthy dispersion, no panic herding. Pressure: 4 heavy-selling days vs 6.5 avg, fear gauge 17 vs 18 typical, just -2.0% off the high. Next: Red 72%, Green 26% — a tendency, not a promise. We positioned for this weeks ago; now the data says take profits into strength, lighten equity. Still eyeing the year-end rally after the reset. Not financial advice.
29
Stock Operator retweeted

Every day $DRAM resembles the $ARKK '21 top and $CSCO 2000 top more and more. These were all leaders in the previous cycle that eventually spilled out to the rest of the market.
While in CSCO's case, the $QQQ was already in a bear market. In the 2021 case though, the QQQ made a new high on the backs of the FAANG stocks hiding money while remaining "strong." I think it's fair to equate FAANG in '21 to MAG7 today.
We can see the circled Oct '21 QQQ chart as pic #4. From there, we went on to make new highs in the next month before the real bear market kicked off.
What kept the indices so strong back then, was the crowding into FAANG names before the market unwind. Similar to the fact the $MAGS stocks are trading near highs today.
In Martin Pring's Technical Analysis Explained, he speaks on rising interest rates coming for the smaller more leveraged companies first because their borrowing costs and balance sheets suffer most. Investors respond by moving into large, financially strong blue chips. The averages are heavily weighted towards those names, hold up while the majority of stocks are already in bear markets. Pring argues "quality" leadership masks weakness. The market looks healthy at the index level but is weak underneath the surface. We can all attest this is the behavior we have been experiencing for months.
The biggest indicator of this is new highs contracting, while the index rises or "seems healthy near highs." Currently just ~45% of all S&P stocks are trading above their 200 day. For context, the historical average is roughly 73% when the index is hitting new highs. In December '21, the S&P set a record after record while only 42% of its stocks were above their 200 days. Bear market of '22 officially kicked off at the top of the year, Jan 4th, 2022.
There was nothing but disbelief about the underlying environment changing at the end of '21 even though the leaders had already been dramatically shot, as we're seeing today. The mistake I made then was to not adjust to the environment quick enough which led to a brutal start to '22.
How I'm personally handling this is to go complete day trader mode and look for 1-3 opportunities a week to look to extract some coin in this market. There is complete lack of consistency in this tape on the day to day. Buying oversold bounces and selling them into strength worked well for me this week. Weak names retesting support-turned-resistance levels on bounces are shorts in my eyes in the future.
Tough to be positive with what we're seeing out there this week! Either you will recognize the shifting environment and make the proper adjustments .... or you wont and will continue to complain about how hard the market is to social media. 🤷♂️
Control what you can control. 🫡


Something smells... This market has something wrong with it. I bet the guys distributing here for the last few months are surprised they were able to keep the indices at highs while they off load. High yield falling out of bed with yields .
45
Wow

Adventure through Hyrule and become the Hero of Time when The Legend of #Zelda: Ocarina of Time releases Nov 5 on Nintendo Switch 2. #NintendoDirect
95

Day 2 of a Red phase that usually lasts ~6 days (median 5). We're 33% through, with a -1.6% move so far vs typical -1.8%.
Breadth confirms the downturn: more new lows than highs, momentum sliding, though 58% of stocks still near highs.
Stock correlation at the 20th percentile signals healthy dispersion — names moving independently.
Fear gauge at 20, below the Red-phase average of 22.
7 distribution days this leg against an average of 3.1, with a -3.0% drawdown.
Next phase is Orange 97% of the time.
Playbook says stay out until the next bottoming phase.
Not financial advice.
40

Day 1 of a Red phase that usually lasts about 6 days (median 5).
Breadth is mixed with more new lows than highs and 50% of stocks near 52-week highs.
Stock correlation at the 4th percentile signals healthy dispersion.
VIX at 17 versus the Red average of 22.
6 heavy-selling days this leg versus the 3.1 average.
Drawdown from the recent high sits at 1.8%.
Next phase is Orange 97% of the time.
Playbook says step aside and stay out until the bottoming phase arrives.
Not financial advice.
43

Day 3 of a Yellow phase that usually lasts about 8 days (median 6), 36% through with a -0.7% move.
Breadth confirming the pause with more new highs than lows, momentum up, and 54% of stocks near 52-week highs.
Stock correlation at the 4th percentile points to healthy dispersion rather than herding.
Fear gauge at 16, below the Yellow average of 18.
DeMark exhaustion at the 73rd percentile signals washed-out conditions.
5 heavy-selling days this leg against an average of 2.9, with a -1.5% drawdown.
History points to Red next 69% of the time.
Playbook calls for taking profits into strength before the decline, dialing equity exposure lower.
Not financial advice.
40
06/18/26 Portfolio Update (21.0% YTD vs $SPY/IWV 9.8%)
Heavy Fixed Income at 29.5% while Mag7 and Hydrogen keep the upside torque intact.
Mag7 - 7.5%
$TSLA [Mag7] - 3.9%
AMZN [Mag7] - 3.6%
Technology - 7.0%
$TTMI [Technology] - 2.5%
$TWLO [Technology] - 1.9%
AEVA [Technology] - 1.6%
PATH [Technology] - 1.0%
Call Spread - 6.2%
TIGR (Calls) [Call Spread] - 1.0%
$ENPH (Calls) [Call Spread] - 0.8%
$OKLO (Calls) [Call Spread] - 0.8%
$CRWV (Calls) [Call Spread] - 0.8%
CPNG (Calls) [Call Spread] - 0.7%
WDAY (Calls) [Call Spread] - 0.6%
MITK (Calls) [Call Spread] - 0.5%
NOW (Calls) [Call Spread] - 0.4%
GTLB (Calls) [Call Spread] - 0.3%
U (Calls) [Call Spread] - 0.2%
SMR (Calls) [Call Spread] - 0.1%
Financials - 5.6%
FIGR [Financials] - 3.7%
RKT [Financials] - 1.6%
FRMM [Financials] - 0.3%
Hydrogen - 5.5%
BLDP [Hydrogen] - 3.4%
BE [Hydrogen] - 2.1%
Consumer Discretionary - 5.2%
CRSR [Consumer Discretionary] - 2.9%
STUB [Consumer Discretionary] - 2.3%
Space - 4.7%
IRDM [Space] - 2.9%
RDW [Space] - 1.9%
Crypto & Blockchain - 4.7%
BMNR [Crypto & Blockchain] - 2.1%
ORBS [Crypto & Blockchain] - 1.3%
MSTR [Crypto & Blockchain] - 1.3%
Healthcare - 4.3%
UNH [Healthcare] - 2.3%
NVO [Healthcare] - 2.0%
Consumer Staples - 3.5%
ELF [Consumer Staples] - 1.9%
CELH [Consumer Staples] - 1.6%
Long Call - 3.4%
BMNR (Calls) [Long Call] - 2.6%
FXY (Calls) [Long Call] - 0.4%
DQ (Calls) [Long Call] - 0.3%
Nuclear - 3.3%
LEU [Nuclear] - 1.7%
BWXT [Nuclear] - 1.6%
Emerging Markets - 3.1%
SE [Emerging Markets] - 2.0%
MELI [Emerging Markets] - 1.1%
Battery - 2.8%
SGML [Battery] - 1.8%
QS [Battery] - 1.0%
Solar - 1.8%
NXT [Solar] - 1.8%
Industrials - 1.1%
PANL [Industrials] - 1.0%
QCLS [Industrials] - 0.1%
Indices & ETFs (Broad Market) - 0.9%
XELLL [Indices & ETFs (Broad Market)] - 0.9%
Fixed Income - 29.5%
STRC [Fixed Income] - 4.1%
VWOB [Fixed Income] - 3.9%
SPHY [Fixed Income] - 3.8%
BIZD [Fixed Income] - 3.8%
EMLC [Fixed Income] - 3.7%
FSCO [Fixed Income] - 1.9%
MGRB [Fixed Income] - 1.9%
AGNC [Fixed Income] - 1.7%
MAIN [Fixed Income] - 1.6%
OXLC [Fixed Income] - 1.5%
MFA [Fixed Income] - 1.0%
JAAA [Fixed Income] - 0.5%
Cash: 0.1%
This book is built for a world where policy rates are still the dominant driver. Nearly 30% in credit and income vehicles gives me a real yield cushion, while the call-spread overlay and concentrated Mag7/Hydrogen sleeves keep asymmetric upside without blowing up beta. The setup assumes cuts arrive before growth rolls over; if that timeline slips, the fixed-income ballast buys time to reload the optionality. Watching credit spreads and Mag7 earnings reactions for the first real test.


2
262