

WD Gann Stock Market Analysis; Squares of 9, 52, 12, Hexagon Movement, Master 360* Circle Chart and More, Gann: "Time is the Resistance To Price"
Joined February 2009
- Tweets15.3K
- Following325
- Followers9.5K
- Likes15.4K


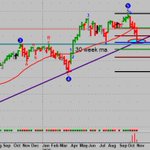


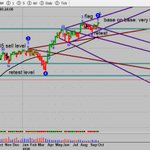
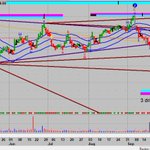
$USO: Weekly, Tline break, back to series of highs n lows, 30 week ma and 50% support, Daily Is Bull Spinner on 100ma, see flat to down thru end of year, may kiss that tline gbye, Ascending Bearish wedge Broken

5
785
$NVDA Weekly, Brown 45* angle, 50% and a triple bottom. Bottoms were 30 weeks apart, this one is 32 weeks. Daily Chart, Yesterday biggest vol since April 2025 when the stock was $90. Break here will mean breakout retest st 150, but it is in Huge support, short rally wont surprise

$COMPQ: Weekly, In Gann Based Ellipse support, trendline support, below 24,425, low of week of July 27, will mean Gann's Gravity Center, 50% and retest of series of old highs, 24,000, 13% Correction. If this happens around Thanksgiving, Gann Holiday Rule, sets up year end rally

2
9
1,304
$SPY GDP: 3.4%, Jobs today: 165,000, blew it away (real jobs not print money hire govt worker shit), 3rd Qtr GDP estimates: 5%, thats a TRUMP economy, these assholes are going to take credit for all the investments he beought in and all the growth: what a shame
4
763
$SPY Big Gann Time Days This Month: Nov 1-4, November 9 (minor reversal or successful 50% level test), mid to late month pause (trend consolidation) into Nov 21-25 triggering Gann's Holiday Rule and a subsequent strong run, very bullish
$SPY Percent Change in Inflation year over year since 1968, Red Line is Cycle that fits really well.:Kitchin Cycle, short term business cycle of app 41 months. Rate of Change expected to come down. 71% chance of it. Note: When inflation declines 3 mos in row, market rises big

$SPY: Red: Composite of 42 mo & a mercury Cycle, Blue: 42 mo Cycle, Bold Green: annual with Seasonality, set to stop @ 4/9/25 low, projection lines working good, from here to 12/6, 26 years up, 6 down, Conditions: Oversold, retest of top, So, Seasonality, Cycles conditions align

7
903
$NKE: Cycle, coming into strength, last 4 years of decade ending in "6" up 3 out of 4 times to end of year and historically there is strong seasonality here, 91% win rate in November

3
850
$NKE Monthly: Vol Telling the story, Big Money Buying, Monthly Bull Signal so far on 45* Angle, a Gann Square Out, Back to 4 lows of Jan-April 2014, Bars on right are Trade Profile

12
1,084


$MRP
This may not be "the bottom" but this is what a Gann Climax bottom looks like. Dividend of about $3, so get paid while u wait.

1
5
898
$TLT: Gann Bull Signal Bar, Massive vol and massivel vol on way down: Gann: Trends end in Climax, needs confirmation take out todays high: Sell 1st rally off low: 81-82 series of bottoms from 2000-2002, Gann: Bottom become Tops, 1st Target

$TLT Monthly, The Greatest Volume by far since it began trading as massive accumulation occurs. Current Interest Rate Correlation with Oil is 66%, IMO: Rates are in process of Topping. Oil Looks corrective

$SPY 32 years analyzed, from here to December 5: 26 up, 6 down, last 10 years, 9 up, 1 down, Average Gain is Huge, seasonality at work

1
8
1,065
$SPX: Kitchin, Presidential, say higher, Kondratieff Wave says lower, Thnx To Sergey on this one

$SPY The last 100 years, 25 midterm election cycles say should be down this week. High Probability of a Gann Downward Final Grand Rush in October, should be a very high volume day when and if it happens
8
1,063
$SPY: Annual Cycle, Grren at bottom is expectation from here thru December 5, Study shoed last 32 years; 27 up, 5 down, those are pretty good odds

1
22
2,145
Oil and The 10 Year yeild have a 96% correlation right now, when oil cracks we will make a bottom i believe in the market

$USO: This is a 520 Day Cycle in Crude Oil, works really well: I set the data to STOP at last April 2025, so the projection line works very well, Green highlight in bottom panel shows near term move

1
10
1,418
$USO: This is a 520 Day Cycle in Crude Oil, works really well: I set the data to STOP at last April 2025, so the projection line works very well, Green highlight in bottom panel shows near term move