

Tableau Public Featured Author | Tableau Community Highlight | #VOTD x5 | https://xitter.cf/t.co/R1hV26AX78 | https://xitter.cf/t.co/uu2m5eLjca
Joined November 2022
- Tweets754
- Following435
- Followers703
- Likes3.3K




Tanya Lomskaya retweeted

This #VizOfTheDay by @ta___kaya breaks down the dual stories of U.S. commerce using an engaging flow chart that contrasts goods purchases with services sales.
Discover how net financial flows vary across free trade partners in this sleek, interactive visualization.
Explore the viz on Tableau Public: tabsoft.co/3UoM4o7




Tanya Lomskaya retweeted
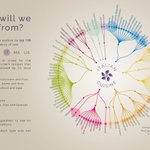
Explore this #VizOfTheDay by @ta___kaya to see how a single dataset can be visualized a hundred different ways—from bars to radials to waffles and beyond.
Check out the viz. tabsoft.co/4tYckTx

Tanya Lomskaya retweeted
This #VizOfTheDay by Louis Phipps, inspired by @ta___kaya, is a comprehensive Superstore Performance Overview dashboard. It uses charts, maps, and trend lines to summarize sales, profit, and order details across regions and segments.
Explore the viz: tabsoft.co/4rku36y

Tanya Lomskaya retweeted

This week I chat with data artist @ta___kaya on turning complex data into visual masterpieces. From chord charts to Voronoi diagrams, discover more about her creative process and the toolkits used🎨
cj-mayes.com/2025/08/10/tany…
Tanya Lomskaya retweeted

Adding @ta___kaya to the #TableauFF list this week because… wow. Her Tableau Public profile is a masterclass in elegance and impact. Clean lines, intentional color palettes, and storytelling that always feels purposeful. #datafam
Link: lnkd.in/g_Xkk-Kj

Yay, thank you so much for the recognition, @tableaupublic! 🥰🥰🥰

Explore this #VizOfTheDay by @ta___kaya which uses a tile map, Sankey chart, and more to visualize the global aging society.
Viz inspired by @ProfDrKSchulte and @WJSutton12.
tabsoft.co/3UcpOdG

Tanya Lomskaya retweeted
This #VizOfTheDay by @SalehArshi tells a compelling story of 40 years of progress.
Using data from the Association for the Prevention of Torture (APT), this @VizFSG entry highlights the global evolution of torture prevention mechanisms: tabsoft.co/3Y8KiaK

Tanya Lomskaya retweeted
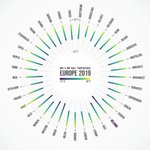
At #DataFamEurope, we highlighted how data helps us make the world more healthy, equal, and artistic.
Explore these visualizations on @tableaupublic from authors across Europe: tabsoft.co/3AKz7eQ


Tanya Lomskaya retweeted

My #IronViz entry is a tribute to Jimmy Buffett & Margaritaville, and explores how his 1977 song made him a billionaire.
🔗 t.ly/UgbrH
Thank you @professorkao @maf2k @sarahlovesdata @GeorgeKoursaros for the feedback! 🙏🍹


Tanya Lomskaya retweeted
Unleashing the power of KPI cards 📊
From area to bar and stacked bar charts, this #VizOfTheDay by @nastengraph visualizes key sales metrics. tabsoft.co/3Y8KiaK

Tanya Lomskaya retweeted
Explore a dynamic map of Ottawa in this #VizOfTheDay by @professorkao—with spatial parameters. 🏙️
See the interactive viz with features in Tableau 2024.3. tabsoft.co/3Y8KiaK
Tanya Lomskaya retweeted

Thank you @tableaupublic for another VOTD ✨
Each of them feels special, and I am glad this viz was selected making it my 4th VOTD😍
Love you and thank you for the motivation to create more such great pieces in the future :)
#datafam
Are kids getting enough sleep? Find out in this #VizOfTheDay by Tableau Visionary @prem_prasann, showcasing the sleep fulfillment rate for students from kindergarten to 12th grade.
Explore this #MakeoverMonday viz 👉 tabsoft.co/3Y8KiaK


Tanya Lomskaya retweeted
Step into the role of data detective with this #VizOfTheDay by @Blu7ip 🕵️♂️
Dive into IMDb ratings, season trends, cast dynamics, and award recognition for TV series Only Murders in the Building.
Discover more in this #DataPlusTV entry. tabsoft.co/3Y8KiaK

Tanya Lomskaya retweeted
Live from the DataFam, it's #DataPlusTV! 🌃
Explore 49 seasons of Saturday Night Live in this #VizOfTheDay by @ZsofiaNika in prep for celebrating 50 years of SNL on television.
Chord chart inspired by @_CJMayes. tabsoft.co/3Y8KiaK

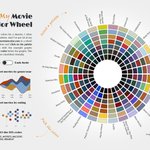
This conversation with @datavizlouis about creating the movie color wheel viz took a slightly unexpected turn 🙃 We discussed journalism, strange sources of inspiration, and working with #Shapely, the coolest #Python library for handling polygons 🩵
#datafam #Tableau


What does journalism have in common with #dataviz? In fact, a lot! @ta___kaya brings us the secrets behind her beautiful @tableau viz "My Movie Color Wheel" 🎥🌈 viz. Get inspired by her unique #datastorytelling journey today #datafam 🔥
youtube.com/watch?v=Bx_7_DRi…
