

Dan Price | Broker, Team Price Real Estate (Austin) 21+ years in real estate. Data-driven analyst focused on market cycles, pricing logic, and housing economics
Austin, Texas
Joined January 2009
- Tweets7.9K
- Following227
- Followers586
- Likes337




Austin metro tax-distressed homes: 3,210. Up 288 in one week, the biggest jump since we started tracking in Sep 2025. County tax records, not MLS. teamprice.com

Austin’s price-to-income ratio has completed a full round trip. In April 2022, the median Austin home cost 5.74 years of the median household income. That was the highest reading in more than 26 years of data. Today that number is 3.63. Austin’s long-run median since 2000 is 3.62.
📉 Down 36.7% from the 2022 peak
📉 Down 8.8% from last October
📊 Lowest October reading since 2013

Nearly 7 in 10 Austin-area homes sold under list price this month: 69.8%, up from 67.6% in September. Metro median sold: $401,990, down 2.8% YoY. City of Austin: up 3.4% to $575,000 as listings fell 7.8%. Two markets, one metro. More : teamprice.com/market-update/…

Austin Area Short sale listings nearly doubled, from 82 a year ago to 158 today. Here is the part most people miss: buyers kept up. Pending short sales rose from 30 to 55, and short sales carry a 25.8% Activity Index compared to 17.3% for the overall market and 14.5% for standard resale.
The average pending short sale price is $310,730. A year ago it was $310,731. Buyers know exactly where the value sits in this segment, and they are moving on it.
If you own a home and are behind on payments, you have more options than you think, and time matters. If you are a buyer or investor, this is a segment worth watching closely.

Distressed properties in the Austin metro are up 34% in a year.
On September 26, 2025, there were 2,198 properties in pre-foreclosure, auction or bank-owned status across Travis, Williamson, Hays, Bastrop, Caldwell and Burnet counties. As of today, that number is 2,937. That is 739 more households and investors dealing with distress, and the count has climbed almost every week since spring.


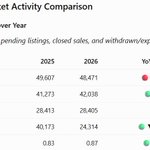
Austin residential activity through October 20 continues to show stronger relative absorption in 2026, but the year-over-year pending advantage has slipped below 2% again. New listings are 2.3% below 2025, representing 1,136 fewer properties entering the market, while pending contracts remain 1.9% higher, with 765 additional contracts. The pending-to-new ratio holds at 0.87 versus 0.83 last year, indicating that a greater proportion of incoming supply is moving under contract. Historically, the new-listing deficit has improved from roughly 4%–5% in May and early June to just over 2%, while pending growth has moderated from the 4%–5% range earlier this summer to less than 2% today. Closed sales remain essentially identical to 2025, trailing by only eight transactions, following a brief four-sale advantage on October 19. Withdrawn and expired listings are 39.5% lower year over year, an unusually large difference that still requires verification of consistent MLS reporting. The central Q4 trend is that 2026 continues to generate more pending contracts from fewer new listings while maintaining nearly identical closed-sales volume, but the narrowing pending advantage suggests the market's earlier demand outperformance is gradually fading.

Austin residential activity through October 19 marks an important milestone as cumulative closed sales move slightly ahead of 2025, with 28,313 transactions compared with 28,309 last year. Although the four-sale advantage is statistically negligible, it represents a recovery from the 303-sale deficit recorded at the end of September. New listings remain 2.3% below 2025, while pending contracts are 2.0% higher, producing 817 additional pending contracts despite 1,130 fewer new listings. The pending-to-new ratio remains stronger at 0.87 versus 0.83, indicating better relative absorption of incoming inventory. Historically, the new-listing deficit has narrowed from roughly 4%–5% in May and early June to just over 2%, while pending growth has moderated from the 4%–5% range earlier this summer to approximately 2% in October. Withdrawn and expired listings are down 39.5% year over year, an unusually large difference that still warrants verification of consistent MLS reporting. The key development entering the second half of October is that 2026 has fewer new listings, more pending contracts, and has now matched 2025 in completed sales, suggesting stronger relative absorption even as the year-over-year advantage in buyer activity continues to moderate.

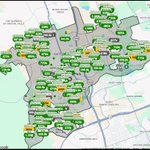
Cedar Park is the #1 city in the Austin area right now. It leads the metro with a 26.41% activity index, ahead of Elgin, Del Valle, Kyle, and every other city we track. Austin sits at 16.51%. Neighboring Leander is at 15.93%. At the same time, Cedar Park has 283 homes for sale from $239,000 to $2,450,000, and the map is full of price reductions. ACTIVITY INDEX = Pending ÷ (Active + Pending). A leading indicator, since pendings show buyer decisions 30 to 60 days before closings.

How is Austin's housing market closing out 2026? Inside the city, the median sold price is up 3.8% to $571,000 as listings drop 7.5%. Across the metro, the median is flat at $405,000 and 72% of homes sold under list. What it means for you: dan.teamprice.com/market-upd…

Austin residential activity through October 14 continues to show stronger relative absorption in 2026, while closed sales remain remarkably close to last year's pace. New listings are 2.2% below 2025, representing 1,058 fewer properties entering the market, while pending contracts are 2.0% higher, with 797 additional contracts. The pending-to-new ratio remains stronger at 0.87 versus 0.83, indicating a greater proportion of incoming listings moving under contract. Historically, the new-listing deficit has narrowed from roughly 4%–5% in May and early June to approximately 2% today, while pending growth has moderated from the 4%–5% range earlier this summer to around 2% entering mid-October. Closed sales are now just 53 transactions, or 0.2%, below 2025, a significant improvement from the 303-sale deficit recorded at the end of September. Withdrawn and expired listings remain 39.3% lower year over year, an unusually large difference that should be validated against consistent MLS reporting definitions. The key Q4 takeaway is that 2026 continues to produce more pending contracts from fewer new listings, while completed sales have nearly matched 2025 despite a steadily narrowing advantage in contract activity.

🔥 October 2026 Top Austin-Area Opportunities: Check out #19!
Original Price: $425,000
Current Price: $295,000
Price drop: $130,000 (-30.6%)
Sold 4+ years ago for OVER $470k!
Check out the entire list : tpre.io/top-100-dan

Austin residential activity through October 13 shows closed sales moving closer to year-over-year parity while the pending advantage stabilizes near 2%. New listings are 2.3% below 2025, representing 1,127 fewer properties entering the market, while pending contracts remain 2.0% higher, with 799 additional contracts. The pending-to-new ratio holds at 0.87 versus 0.83 last year, indicating stronger relative absorption of incoming inventory. Historically, the new-listing deficit has narrowed from roughly 4%–5% in May and early June to approximately 2% today, while pending growth has cooled from the 4%–5% range earlier this summer to around 2% as Q4 progresses. The most encouraging development is closed sales, which have narrowed from a 303-transaction deficit at the end of September to just 55 fewer sales, or 0.2% below 2025, bringing completed transaction volume nearly even with last year. Withdrawn and expired listings remain 39.2% lower year over year, an unusually large difference that warrants verification of consistent MLS reporting before drawing market conclusions. The central Q4 trend remains fewer new listings, more pending contracts, and nearly identical closed sales compared with 2025, although the shrinking pending advantage suggests buyer activity is moderating as the market moves deeper into fall.

Austin residential activity through October 12 shows a modest recovery in pending and closed-sales comparisons, although the broader cooling trend remains intact. New listings are 2.4% below 2025, with 1,149 fewer properties entering the market, while pending contracts are 2.0% higher, representing 810 additional contracts. The pending-to-new ratio remains stronger at 0.87 versus 0.83 last year, indicating better relative absorption despite fewer incoming listings. Historically, pending growth has slowed considerably from the 4%–5% range during June and July to approximately 2% today, while the new-listing deficit has improved from roughly 4%–5% in the spring but widened slightly since late September. Closed sales have recovered from a 202-transaction deficit on October 11 to just 140 fewer sales, or 0.5% below 2025, keeping cumulative completed volume near last year's pace. Withdrawn and expired listings remain 39.2% lower year over year, an unusually large discrepancy that still requires verification of consistent MLS reporting. The key Q4 signal is that 2026 continues to generate more pending contracts from fewer new listings, but its demand advantage has narrowed significantly since summer, while closed sales remain slightly below last year.

Austin residential activity through October 11 shows the year-over-year pending advantage slipping below 2% for the first time in this recent tracking period, signaling further moderation in contract activity as Q4 progresses. New listings are 2.4% below 2025, widening from the 1.9% deficit recorded October 8, while pending contracts are now just 1.9% higher, down from 2.3% three days earlier. Historically, pending growth was running around 4%–5% during June and July, meaning the year-over-year advantage has narrowed considerably even as the pending-to-new ratio remains stronger at 0.86 versus 0.83 last year. Closed sales are now 202 transactions, or 0.7%, below 2025, compared with a 96-sale deficit on October 8, showing that completed transactions are losing some ground despite the stronger cumulative pending pipeline. Withdrawn and expired listings remain an unusually large 39.3% below last year, a difference that should be validated against consistent MLS reporting definitions. The emerging Q4 trend is that 2026 continues to absorb incoming listings at a higher relative rate than 2025, but both the pending advantage and closed-sales performance are weakening, suggesting that the market's earlier demand advantage is gradually fading as seasonal activity slows.

Austin residential activity through October 8 shows a notable symmetry in supply and demand: 898 fewer new listings and exactly 898 more pending contracts compared with 2025. New listings are down 1.9% year over year, while pending activity remains 2.3% higher, maintaining a stronger pending-to-new ratio of 0.86 versus 0.83 last year. Historically, the new-listing deficit has narrowed from roughly 4%–5% in May and early June to less than 2% today, while pending growth has moderated from its earlier 4%–5% pace to approximately 2%. Closed sales remain nearly even with 2025, trailing by just 96 transactions, or 0.3%, indicating that stronger contract activity has not yet translated into higher cumulative completed sales. Withdrawn and expired listings remain 39.1% below last year, an unusually large difference that warrants verification of consistent MLS reporting. The central Q4 trend remains stronger relative absorption, but with the pending advantage gradually shrinking, the market is showing signs of seasonal cooling even as 2026 continues to outperform 2025 in contract activity.


Austin residential activity through October 7 continues to show stronger relative absorption in 2026, but the pending advantage is gradually narrowing. New listings remain 2.0% below 2025, while pending contracts are 2.2% higher, representing 886 more pending contracts despite 975 fewer new listings. The pending-to-new ratio holds at 0.87 versus 0.83 last year, indicating that a greater proportion of incoming supply is moving under contract. Historically, the new-listing deficit has improved from roughly 4%–5% in May and early June to approximately 2% today, while pending growth has slowed from the 4%–5% range earlier this summer to just above 2%. Closed sales remain nearly identical to last year, trailing by only 89 transactions, or 0.3%, but have yet to reflect the stronger cumulative pending activity. Withdrawn and expired listings are down an unusually large 39.1%, a difference that warrants verification of consistent MLS reporting before drawing conclusions. The key Q4 development is that supply and demand are both slowing seasonally, but 2026 continues to generate more contracts from fewer new listings, even as its year-over-year pending advantage gradually compresses.
